getTheme
Class: matlab.graphics.chartcontainer.ChartContainer
Namespace: matlab.graphics.chartcontainer
Syntax
Description
gt = getTheme(obj)GraphicsTheme object for the parent figure of the specified
ChartContainer object. To determine the theme of the figure, query the
BaseColorStyle property of gt.
The update method of the chart container executes when the figure theme
changes, so you can call this method from within the update method of your
subclass to respond to changes in the figure theme.
Input Arguments
Output Arguments
Examples
Define a class named ThemedSmoothPlot that plots a set of data using a faint line as well as a smoothed version of the same data using a bolder line.
To define the class, create a file named ThemedSmoothPlot.m that contains the following class definition with these features:
XDataandYDatapublic properties that store the x- and y-coordinate data for the original lineSmoothWidthpublic property that controls the width of the smooth lineOriginalLineandSmoothLineprivate properties that store theLineobjects for the original and smoothed dataA
setupmethod that initializesOriginalLineandSmoothLineAn
updatemethod that updates the plot when the user changes the value of a propertyA
createSmoothDatamethod that calculates a smoothed version ofYDataAn
updateColormethod that selects plot colors based on the theme of the figure
classdef ThemedSmoothPlot < matlab.graphics.chartcontainer.ChartContainer
    properties
        XData (1,:) double = NaN
        YData (1,:) double = NaN
        SmoothWidth (1,1) double = 2
    end
    properties(Access = private,Transient,NonCopyable)
        OriginalLine matlab.graphics.chart.primitive.Line
        SmoothLine matlab.graphics.chart.primitive.Line
    end

    methods(Access = protected)
        function setup(obj)
            % Create the axes
            ax = getAxes(obj);

            % Create the original and smooth lines
            obj.OriginalLine = plot(ax,NaN,NaN);
            hold(ax,"on")
            obj.SmoothLine = plot(ax,NaN,NaN);
            hold(ax,"off")
        end
        function update(obj)
            % Update line data
            obj.OriginalLine.XData = obj.XData;
            obj.OriginalLine.YData = obj.YData;
            obj.SmoothLine.XData = obj.XData;
            obj.SmoothLine.YData = createSmoothData(obj);

            % Update line colors and smooth line width
            updateColor(obj);
            obj.SmoothLine.LineWidth = obj.SmoothWidth;
        end

        function sm = createSmoothData(obj)
            % Calculate smoothed data
            v = ones(1,10)*0.1;
            sm = conv(obj.YData,v,"same");
        end

        function updateColor(obj)
            OriginalLineColor = [0.6 0.7 1];
            SmoothLineColor = [0.3 0.4 0.7];
            thm = getTheme(obj);
            switch thm.BaseColorStyle
                case "light"
                    % Use OriginalLineColor and SmoothLineColor
                    obj.OriginalLine.Color = OriginalLineColor;
                    obj.SmoothLine.Color = SmoothLineColor;
                case "dark"
                    % Flip OriginalLineColor and SmoothLineColor
                    obj.OriginalLine.Color = fliplightness(OriginalLineColor);
                    obj.SmoothLine.Color = fliplightness(SmoothLineColor);
            end
        end
    end
end
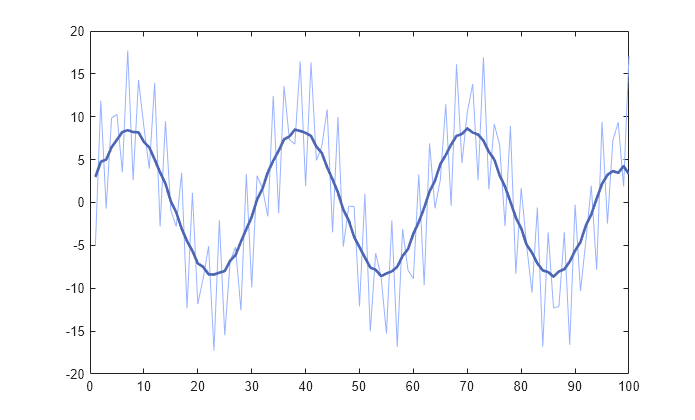
Create a light-themed figure. Then plot pair of x and y vectors by calling the ThemedSmoothPlot constructor method and specifying the XData and YData name-value arguments.
f = figure(Theme="light");
f.Position(3:4) = [695 420];
x = 1:1:100;
y = 10*sin(x./5) + 8*sin(10.*x + 0.5);
ThemedSmoothPlot(XData=x,YData=y);
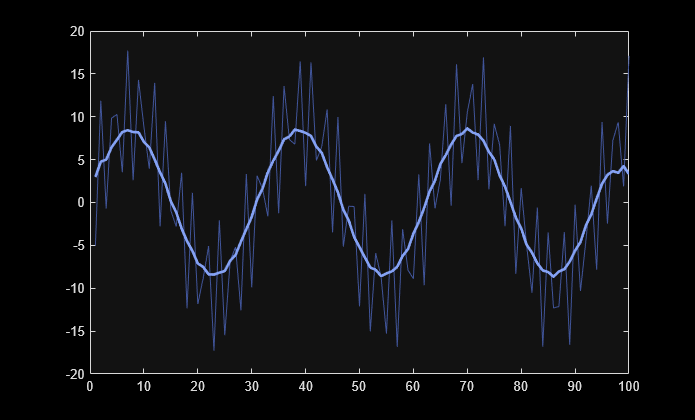
Change the theme of the figure to "dark". The line colors update in response.
theme(gcf,"dark")
Version History
Introduced in R2025a