plotedit
Interactively edit and annotate plots
Description
plotedit toggles the state of plot edit mode for the current
figure. If no current figure exists, plotedit creates one.
Alternatively, you can click Select & Plot Edit on the
Format tab of a figure window.
Plot edit mode allows you to use a graphical interface to edit and annotate plots easily. In plot edit mode, you can modify properties of graphics objects.
plotedit( changes the state of plot edit
mode on the figure. For example, state)plotedit("on") starts plot edit mode for
the current figure.
plotedit( operates on the
specified figure instead of the current figure. The input fig,___)fig can precede
any of the input argument combinations in the previous syntaxes.
Examples
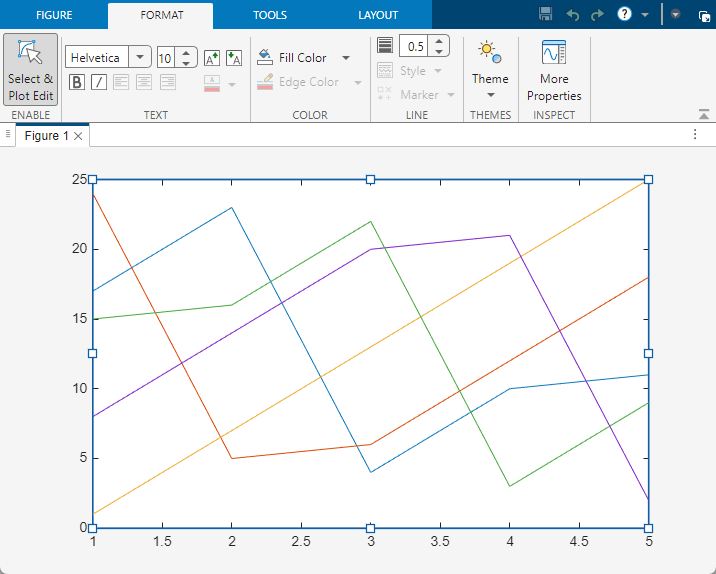
Create a line plot and toggle the state of plot edit mode for the
figure by calling the plotedit function.
plot(magic(5))
plotedit
Input Arguments
Limitations
Plot edit mode does not support selecting UI panels and components, such as
uipaneloruitable. To create figure-based apps, use App Designer.
Alternatives
Start or end plot edit mode by clicking the Select & Plot Edit button on the Format tab of the figure window.