Display Medical Image Volume in Patient Coordinate System
This example shows how to display 3-D CT data in the patient coordinate system using volshow. The volshow function uses the spatial referencing information from a medicalVolume object to transform intrinsic image coordinates, in voxel units, to patient coordinates in real-world units such as millimeters. This is particularly useful for visualizing anisotropic image voxels, which have unequal spatial dimensions. Viewing images in the patient coordinate system accurately represents the aspect ratio of anisotropic voxels, which avoids distortions in the image. If you do not have Medical Imaging Toolbox™ installed, see volshow (Image Processing Toolbox™).
Download Image Volume Data
This example uses a chest CT volume saved as a directory of DICOM files. The volume is part of a data set containing three CT volumes. The size of the entire data set is approximately 81 MB. Download the data set from the MathWorks® website, then unzip the folder.
zipFile = matlab.internal.examples.downloadSupportFile("medical","MedicalVolumeDICOMData.zip");
filepath = fileparts(zipFile);
unzip(zipFile,filepath)
dataFolder = fullfile(filepath,"MedicalVolumeDICOMData","LungCT01");
Import Image Volume
Create a medicalVolume object that contains the image data and spatial referencing information for the CT volume. The Voxels property contains a numeric array of the voxel intensities. The VoxelSpacing property indicates that the voxels are anisotropic, with a size of 0.7285-by-0.7285-by-2.5 mm.
medVol = medicalVolume(dataFolder)
medVol =
  medicalVolume with properties:

                 Voxels: [512×512×88 int16]
         VolumeGeometry: [1×1 medicalref3d]
           SpatialUnits: "mm"
            Orientation: "transverse"
           VoxelSpacing: [0.7285 0.7285 2.5000]
           NormalVector: [0 0 1]
       NumCoronalSlices: 512
      NumSagittalSlices: 512
    NumTransverseSlices: 88
           PlaneMapping: ["sagittal"    "coronal"    "transverse"]
               Modality: "CT"
          WindowCenters: [88×1 double]
           WindowWidths: [88×1 double]
Display Image Volume
Create a colormap and transparency map to display the rib cage. The values have been determined using trial and error.
alpha = [0 0 0.72 1.0];
color = [0 0 0; 186 65 77; 231 208 141; 255 255 255] ./ 255;
intensity = [-3024 100 400 1499];
queryPoints = linspace(min(intensity),max(intensity),256);
alphamap = interp1(intensity,alpha,queryPoints)';
colormap = interp1(intensity,color,queryPoints);
To display the volume in patient coordinates, pass the medicalVolume object as input to volshow. Specify the custom colormap and transparency map, as well as the cinematic rendering style, which displays the volume with realistic lighting and shadows. The axes display indicators label the inferior/superior (S), left/right (L), and anterior/posterior (P) anatomical axes.
volPatient = volshow(medVol,Colormap=colormap,Alphamap=alphamap,RenderingStyle="CinematicRendering");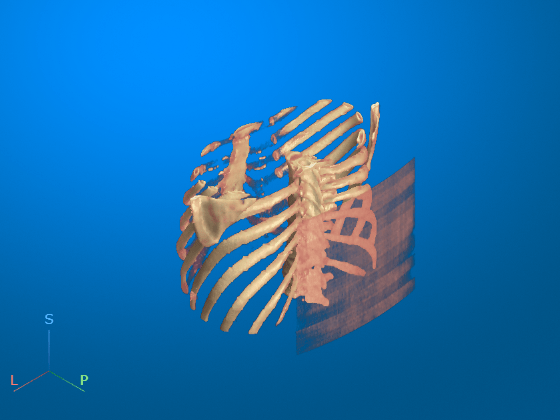
Pause to apply all of the cinematic rendering iterations before updating the display in Live Editor.
pause(3.5)
drawnow
The volshow function uses the spatial details in medVol to set the Transformation property of the output Volume object, volPatient. Display the transformation used to display the anisotropic voxels for this volume.
volPatient.Transformation.A
ans = 4×4

         0    0.7285         0 -187.2285
    0.7285         0         0 -187.2285
         0         0    2.5000 -283.7500
         0         0         0    1.0000
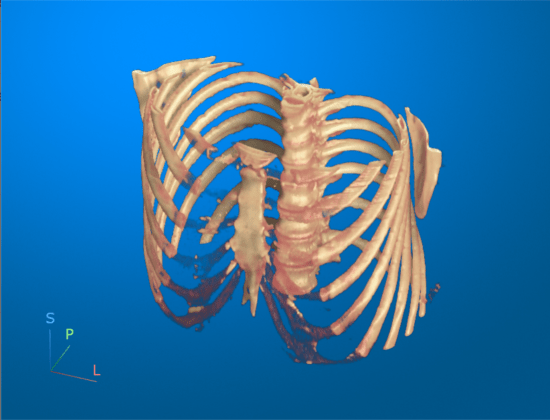
Optionally, you can clean up the viewer window by using the 3-D Scissors tool, ![]() , to remove the patient bed. For a detailed example, see Remove Objects from Volume Display Using 3-D Scissors. This image shows the final volume display after removing the patient bed and rotating to view the anterior side of the patient.
, to remove the patient bed. For a detailed example, see Remove Objects from Volume Display Using 3-D Scissors. This image shows the final volume display after removing the patient bed and rotating to view the anterior side of the patient.
See Also
medicalVolume | medicalref3d | intrinsicToWorldMapping | volshow
Related Topics
Select a Web Site
Choose a web site to get translated content where available and see local events and offers. Based on your location, we recommend that you select: United States.
You can also select a web site from the following list
Americas
- América Latina (Español)
- Canada (English)
- United States (English)
Europe
- Belgium (English)
- Denmark (English)
- Deutschland (Deutsch)
- España (Español)
- Finland (English)
- France (Français)
- Ireland (English)
- Italia (Italiano)
- Luxembourg (English)
- Netherlands (English)
- Norway (English)
- Österreich (Deutsch)
- Portugal (English)
- Sweden (English)
- Switzerland
- United Kingdom (English)
Asia Pacific
- Australia (English)
- India (English)
- New Zealand (English)
- 中国
- 日本Japanese (日本語)
- 한국Korean (한국어)