PLL Design and Verification Using Data Sheet Specifications
This example shows how to use Mixed-Signal Blockset™ to model a commercial off-the-shelf integer-N phase-locked loop (PLL) with dual modulus prescaler operating around 4 GHz. You can verify the PLL performance, including phase noise.
You can use PLL models to explore and design different loop filters, simulate different operating frequencies, determine different divider ratios, or assess the frequency synthesizer performance once embedded in a larger system. For example, Mixed-Signal Blockset PLL models can be helpful if you need to integrate a PLL into a System on Chip or a System on Board.
For this example, use the data sheet of Skyworks SKY73134-11. This is a wideband PLL Frequency Synthesizer operating between 350 MHz and 6.2 GHz.
Build VCO Model
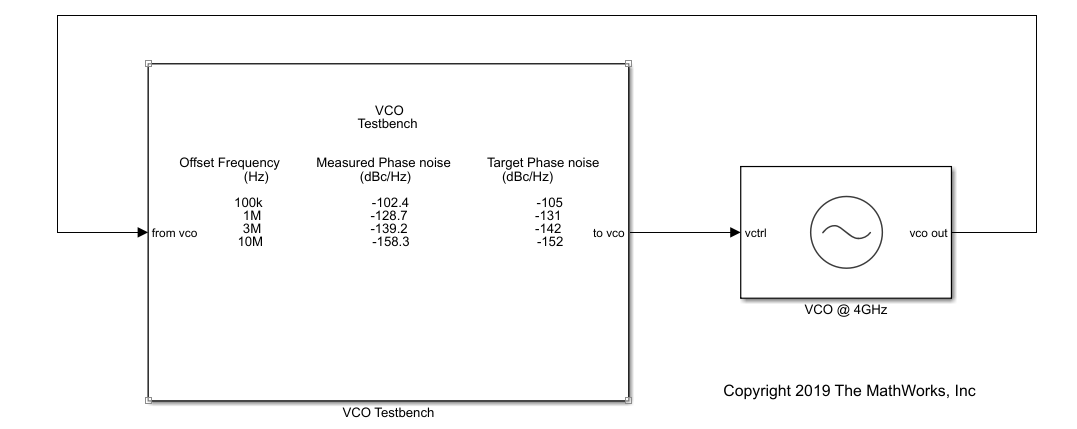
Open the model VCO_model, which has VCO and VCO Testbench blocks from Mixed-Signal Blockset connected together.
model = 'VCO_model';
open_system(model);

Inspect the data sheet to identify the characteristics of the voltage controlled oscillator (VCO). VCO is the main component contributing to the phase noise of the PLL. Table 6 of the data sheet lists the typical VCO sensitivity (Kvco) as 20 MHz/V. Set the Voltage Sensitivity of the VCO block to 20e6 Hz/V. The data sheet does not provide the free running frequency (Fo) of the VCO, so you can set it to an arbitrary value close to the operting frequency. In this case, set Free running frequency to 3.9e9 Hz.
For this example, simulate the PLL behavior when the PLL locks around 4 GHz. Table 7 of the data sheet lists the VCO phase noise profile as: around 4 GHz is,
−105 dBc/Hz at 100 kHz
−131 dBc/Hz at 1 MHz
−142 dBc/Hz at 3 MHz
−152 dBc/Hz at 10 MHz
Use the phase noise profile to add phase noise impairment to the VCO. To speed up simulation, ignore the phase noise data points at lower frequency offsets. Simulation takes longer to capture the phase noise profile close to the carrier.
Measure VCO Phase Noise
The testbench provides the control voltage (Vctrl) stimulus to the VCO and measures the VCO phase noise. The output frequency (F) of the VCO is :

Substituting the values for the output frequency, the free running frequency, and the voltage sensitivity, the equation gives a control voltage of be 5 V.
Click on Autofill setup parameters and Autofill target metric buttons to automatically populate the measurement parameters for both setup and target metric. The target metric provides the anticipated phase noise profile for comparison with the simulation results. The testbench setup properties define the signal sampling frequency and the measurement resolution bandwidth.
To speed up simulation time, reduce No. of spectral averages to 4.
Run the simulation. Verify that the VCO model reproduces the phase noise profile specified in the target metric.

You can now proceed with modeling the complete PLL system and verify its phase noise performance.
Build PLL Model
From the Features section of the data sheet, see that this PLL is of type integer-N and it uses a dual modulus prescaler. The data sheet also provides the settings for the prescaler. Hence, use the Integer-N PLL with Dual Modulus Prescaler from Mixed-Signal Blockset.
bdclose(model);
model = 'PLL_model';
open_system(model);

Open the mask of the PLL block and provide the specs for each of the subsystems:
Phase Frequency Detector — For the phase frequency detector (PFD), the data sheet does not provide any detail. Leave the deadband compensation to its default value.
Charge Pump — For the charge pump, the data sheet provides the typical value for the current of 2.7 mA (data sheet, Table 5). Specify the same value in the PLL model.
VCO — For the VCO, use the same specifications used in the Build VCO Model section. The sensitivity is equal to
20MHz/V. Specify a free running frequency that is close to the final locking frequency, for example4.18GHz. Include phase noise with the same noise profile that you just simulated.
Divider — For the PLL to lock at 4.2 GHz when using a reference oscillator operating at 1.6 MHz (data sheet, Figure 17), the divider ratio is equal to:

To achieve the effective divider ratio of 2625, set the Prescaler divider value to 16, Swallow counter value to 17, and Program counter value to 163.
Loop Filter — The data sheet provides the recommended loop filter component values in Figure 22. Manually input these values to implement the filter. Set Loop filter type to 3rd order passive. Also set the loop filter component values:
C1 = 100e-12 F
C2 = 2.2e-9 F
C3 = 100e-12 F
R2 = 10e3 
R3 = 2.2e3
Verify the closed and open loop performance of the PLL with this implementation of the loop filter. The resulting phase margin is 55 degrees. The phase margin along with the pole zero locations confirm the stability of the PLL.


Use this setup to design different loop filters and verify your design. For example, use this PLL over a different operating frequency.
Finally, to verify the PLL locking behavior in the time domain, probe and plot the output signal of the loop filter.
Measure PLL Performance
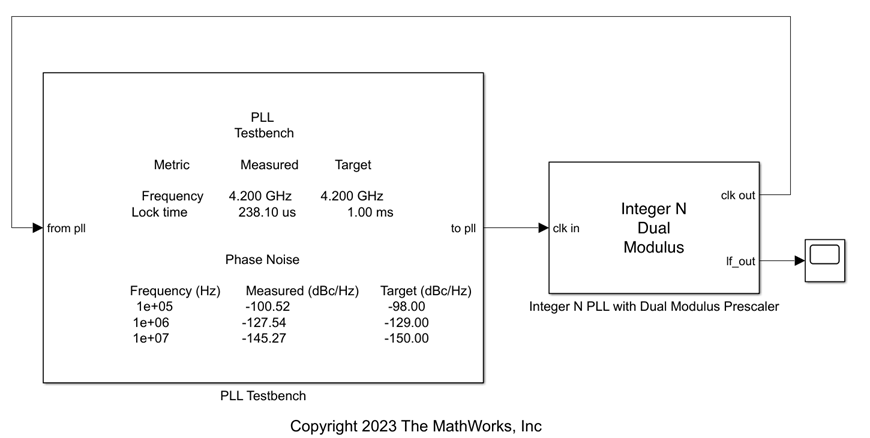
Connect the PLL to a Mixed-Signal Blockset PLL Testbench to validate its performance. The testbench defines the stimuli used to test the PLL. In this case, use a square waveform with 1.6 MHz frequency.
Set up the testbench to measure operating frequency, lock time, and phase noise. The data sheet specifies a 1 ms lock time with 1 ppm frequency error, that is to say 4.2 kHz (Table 5). Provide the same error tolerance. For measuring the phase noise, use a configuration similar to the one used for the VCO, but reduce the resolution bandwidth for higher accuracy.
For the target metric, refer to the data sheet for both the lock time (Table 5) and the closed loop phase noise measurements performed on the evaluation board (Figure 17). The phase noise profile measured at 4.2 GHz is:
−98 dBc/Hz at 100 kHz
−129 dBc/Hz at 1 MHz
−150 dBc/Hz at 10 MHz
With this setup, run the PLL simulation and verify the performance.

In this case, the simulation takes a few minutes. To speed up simulation time, you can relax the settings for measuring the phase noise. For example, use a larger resolution bandwidth or reduce the number of spectral averages.
The simulation results are in excellent agreement with the phase noise measurements reported in the data sheet.
Reference
Copyright(C) 2019 The MathWorks, Inc. All rights reserved.
See Also
VCO | VCO Testbench | Integer N PLL with Dual Modulus Prescaler | PLL Testbench