labelSpectrogramOptions
Description
Use a labelSpectrogramOptions object to store spectrogram options for signal
labeling in the time-frequency domain. You can use spectrogram options to create
time-frequency region-of-interest (ROI) label definitions.
Creation
Syntax
Description
opts = labelSpectrogramOptionsopts, that stores the spectrogram options with default
values.
opts = labelSpectrogramOptions(resType)
opts = labelSpectrogramOptions(resType,PropertyName=Value)
opts = labelSpectrogramOptions("rbw",Overlap=90, ...
Window="kaiser",WindowAttenuationKaiser=50)Input Arguments
Properties
Object Functions
getTFMap | Get short-time Fourier transform for time-frequency labeling |
getTFMapSize | Get size of short-time Fourier transform for time-frequency labeling |
Examples
Create a set of spectrogram options for a signal label definition. Specify a Hamming window with a length of 1024 samples.
 opts = labelSpectrogramOptions("windowlength", ...
     Overlap=50, ...
     Window="hamming", ...
     WindowLengthMode="specify",WindowLength=1024)
opts =
  labelSpectrogramOptions with properties:

          ResolutionType: "windowlength"
                 Overlap: 50
                  Window: "hamming"
        WindowLengthMode: "specify"
            WindowLength: 1024
                NFFTMode: "auto"
    MinimumThresholdMode: "auto"
             UseDecibels: 1
Create a time-frequency ROI signal label definition with time-frequency options.
 signalLabelDefinition("LowBand", ...
     LabelType="roiTimeFrequency",TimeFrequencyOptions=opts);
Label Gaussian atoms in the time-frequency domain using a time-frequency region-of-interest (ROI) label definition and spectrogram options.
Generate Signal and Visualize Spectrogram
Generate a signal that consists of a voltage-controlled oscillator and four Gaussian atoms. The signal is sampled at 14 kHz for 2 seconds. Plot the spectrogram of the signal.
Fs = 14000;
t = (0:1/Fs:2)';
st = 0.01;
gaussFun = @(A,x,mu,f) exp(-(x-mu).^2/(2*st^2)).*sin(2*pi*f.*x)*A';
atomTimeCenters = [0.2 0.5 1 1.75];
atomFreqCenters = [2 6 2 5]*1000;
s = gaussFun([1 1 1 1]/10,t,atomTimeCenters,atomFreqCenters);
x = vco(chirp(t+.1,0,t(end),3).*exp(-2*(t-1).^2),[0.1 0.4]*Fs,Fs);
s = s/10+x;

bt = 0.2;
tr = 0.05;
op = 99;
pspectrum(s,Fs,"spectrogram", ...
    Leakage=bt,TimeResolution=tr,OverlapPercent=op)
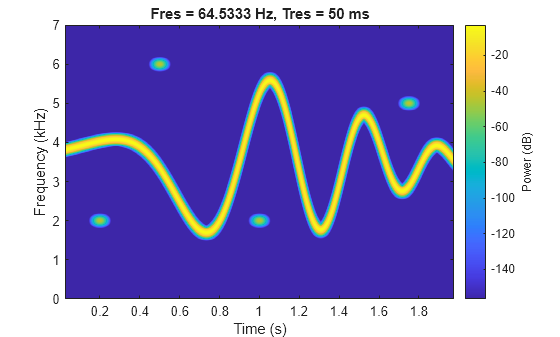
The spectrogram shows four patches in time-frequency domain that correspond with the Gaussian atoms. Define the times and frequencies for all the atoms.
atomTimes = atomTimeCenters'+[-st st]*5.5;
atomFreqs = atomFreqCenters'+[-1 1]*200;
Label Signal in Time-Frequency Domain
Create a logical time-frequency ROI label definition to label the Gaussian atoms. Specify spectrogram options with leakage properties.
opts = labelSpectrogramOptions("leakage", ...
    Leakage=40*(1-bt),Overlap=op, ...
    TimeResolutionMode="specify",TimeResolution=tr);

lblDef = signalLabelDefinition("Atom", ...
    LabelDataType="logical", ...
    LabelType="roiTimeFrequency",TimeFrequencyOptions=opts);
Create a labeled signal set from the signal and time-frequency ROI label definition.
lss = labeledSignalSet(s,lblDef,SampleRate=Fs);
Label the four atoms in time-frequency domain. Set the label values to true.
setLabelValue(lss,1,"Atom",atomTimes,atomFreqs,true(1,4))Visualize Time-Frequency Image and Label Mask
Create datastores from the labeled signal set for the time-frequency ROI label.
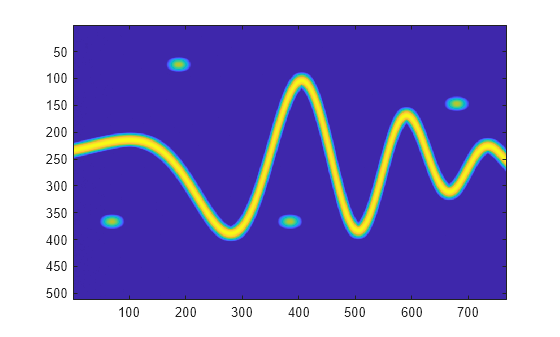
imSize = [512 768];
[sds,ads] = createDatastores(lss,"Atom", ...
    TimeFrequencyMapFormat="image", ...
    TimeFrequencyImageSize=imSize, ...
    TimeFrequencyLabelFormat="mask", ...
    TimeFrequencyMaskPriority=true);
Read and show the time-frequency image.
imagesc(read(sds))
Read the label mask and display it above the time-frequency image.
lbl = read(ads);
im = zeros([imSize 3]);
im(:,:,1) = lbl{1};
hold on
imagesc(im,AlphaData=0.5*lbl{1})
hold off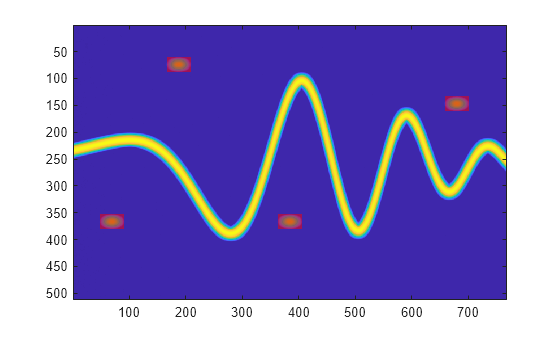
More About
Version History
Introduced in R2025a