plotOnSubPlot
Plot Simulink.sdi.Signal object on Simulation Data Inspector
subplot
Description
Examples
This example demonstrates how to access the Simulink.sdi.Run object for a Simulation Data Inspector run created by logging signals. From the Simulink.sdi.Run object you can get Simulink.sdi.Signal objects that contain the logged signal data and metadata. You can use the Signal objects and the plotOnSubPlot function to plot the data in the Simulation Data Inspector.
Create a Simulation Run and Access the Run Object
The vdp model logs two signals. To create a simulation run containing the logged data, simulate the model.
mdl = "vdp";
sim(mdl);
The Simulation Data Inspector keeps track of runs by assigning a unique numeric run ID to each run created by simulation, importing data, or opening a session. To access the run object for the simulation you just performed, use the Simulink.sdi.getAllRunIDs function and take the last run ID in the returned vector.
runIDs = Simulink.sdi.getAllRunIDs;
runID = runIDs(end);
Once you have the run ID for the run, you can use the Simulink.sdi.getRun function to get the Simulink.sdi.Run object that corresponds to the run. You can use the Run object to check the metadata associated with the run, including the number of signals in the run.
vdpRun = Simulink.sdi.getRun(runID);

vdpRun.SignalCount
ans = int32

4
Plot Data Using Signal Objects
Use the getSignalByIndex function to access signals from the Run object, vdpRun.
signal1 = getSignalByIndex(vdpRun,1);
signal2 = getSignalByIndex(vdpRun,2);
Use the Simulink.sdi.setSubPlotLayout function to specify a 2-by-1 layout.
Simulink.sdi.setSubPlotLayout(2,1)
Before plotting the data, use the Simulink.sdi.clearAllSubPlots function to clear any data that is already plotted.
Simulink.sdi.clearAllSubPlots
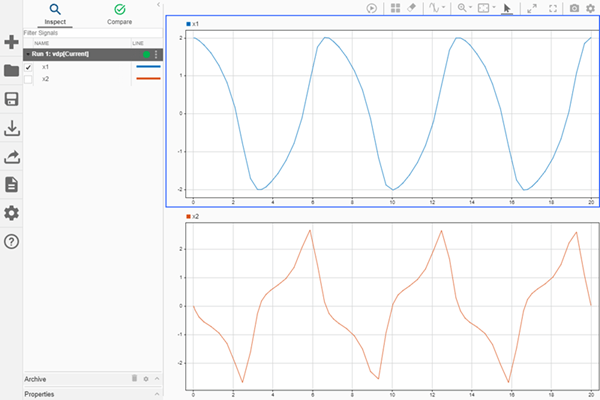
Plot one signal on each subplot. To plot signals on the first subplot, you can set the checked property for the signal. To plot signals on subplots other than the first subplot, use the plotOnSubPlot function.
signal1.Checked = true;
plotOnSubPlot(signal2,2,1,true);
View the Plotted Data
To view the plots you just created, open the Simulation Data Inspector using the Simulink.sdi.view function.
Input Arguments
Alternatives
You can use the Simulation Data Inspector UI to modify the plot layout and plotted signals. For more information, see Inspect Simulation Data.
Version History
Introduced in R2017b