Conectar transiciones para crear rutas y diagramas de flujo
Puede conectar múltiples transiciones a una sola ruta, a una ruta ramificada o a un diagrama de flujo utilizando intersecciones.
En Stateflow®, una ruta consiste en una o múltiples transiciones que conectan un origen y un destino. Puede crear una ruta con múltiples transiciones conectando cada transición a una intersección. Las intersecciones son objetos gráficos que representan un punto de decisión y aparecen como círculos en el área de diseño. Por ejemplo, en el gráfico que se muestra a continuación, múltiples transiciones e intersecciones forman una única ruta de un estado a otro.
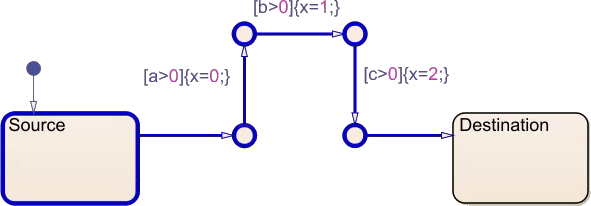
Cuando un gráfico evalúa una ruta, evalúa cada transición conectada en la misma unidad de tiempo, en orden de origen a destino, y ejecuta cualquier acción de condición que encuentre. Si el gráfico encuentra una condición falsa, deja de evaluar la ruta. Si el gráfico no encuentra ninguna condición falsa en la ruta, se desplaza del origen al destino.
Por ejemplo, en el gráfico anterior, una ruta con múltiples transiciones conecta un estado de origen a un estado de destino. Si todas las condiciones de la ruta son verdaderas, el gráfico establece x en 0, 1 y, después, 2. Luego, en el mismo paso, el gráfico sale del estado de origen y entra en el estado de destino.
No obstante, si a y c son mayores que 0, pero b no lo es, el gráfico establece x en 0 y deja de evaluar la ruta.
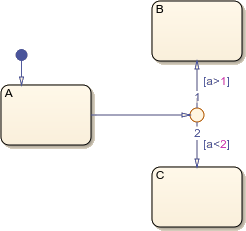
Puede crear múltiples transiciones a o desde un estado o intersección. Si un estado o intersección tiene múltiples transiciones salientes, el gráfico muestra el orden de evaluación. Si el gráfico avanza por una de las rutas, no evalúa el resto de las rutas. Puede cambiar el orden haciendo clic con el botón secundario en la transición, haciendo clic en Execution Order y seleccionando un orden nuevo.
Por ejemplo, el gráfico que aparece a continuación evalúa la ruta desde el estado A al estado B antes que la ruta desde el estado A al estado C.
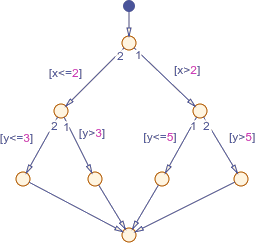
En Stateflow, un diagrama de flujo hace referencia a un gráfico o estado cuyos elementos secundarios están formados exclusivamente por intersecciones y transiciones. Todas las rutas de un diagrama de flujo deben terminar en una intersección única compartida. Puede crear un diagrama de flujo en cualquier nivel de una jerarquía de gráfico.
En este ejemplo, se añade un diagrama de flujo a un modelo de un sistema de baterías recargables. El diagrama de flujo hace coincidir la salida del sistema de baterías con la demanda del dispositivo conectado, sin sobrepasar los límites de la batería.
Abrir el modelo
Para construir el modelo, siga las instrucciones del paso anterior del tutorial. Alternativamente, utilice el botón Open Model de la parte superior y abra el modelo sfGetStartedFlowchart.
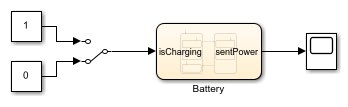
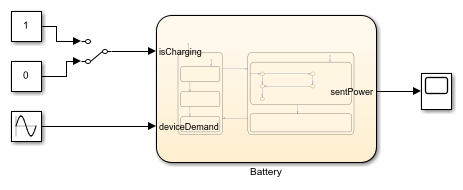
Haga doble clic en el bloque Chart para entrar en el gráfico Battery.
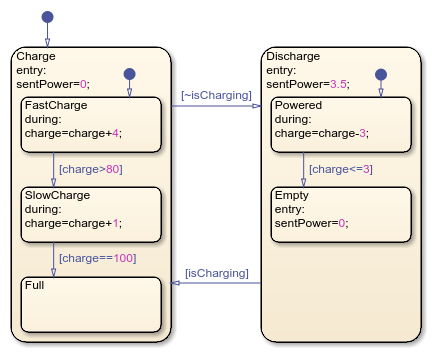
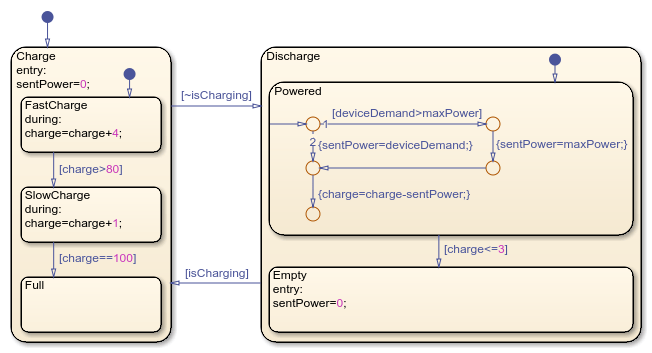
Los estados Charge y Discharge representan los modos de funcionamiento del sistema de baterías. Cada estado contiene estados secundarios que representan las velocidades de carga y descarga cuando la batería se va cargando o descargando. La entrada isCharging determina el estado activo. Los datos sentPower y charge representan la potencia de salida y el nivel de carga de la batería.
Crear un diagrama de flujo
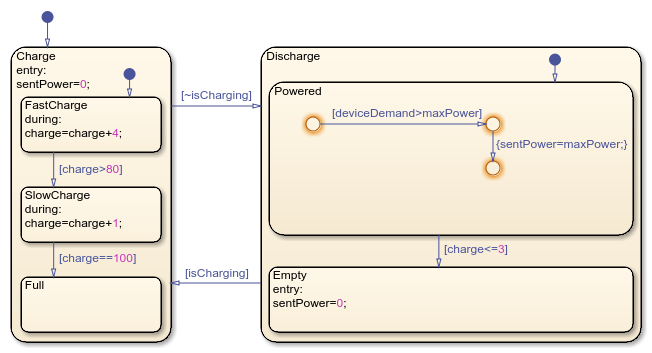
Cuando la batería se descarga mientras está conectada a una fuente de alimentación, la potencia de salida se mantiene constante. En el estado Powered, cree un diagrama de flujo que haga coincidir la salida de la batería con la demanda del dispositivo conectado, sin sobrepasar un valor máximo.
Añada una ruta que represente que el dispositivo demanda más potencia de la que la batería puede proporcionar.
En el estado
Discharge, elimine la acciónentry.En el estado
Powered, elimine la acciónduring.En el estado
Powered, añada la primera intersección. En la paleta, haga clic en el icono Intersección. Coloque la intersección en el estadoPowered.Añada una segunda intersección a la derecha de la primera.
Añada una tercera intersección debajo de la segunda.
Represente una transición desde la primera intersección a la segunda. Añada la condición
[deviceDemand>maxPower].Represente una transición desde la segunda intersección a la tercera. Añada la acción
{sentPower=maxPower;}.
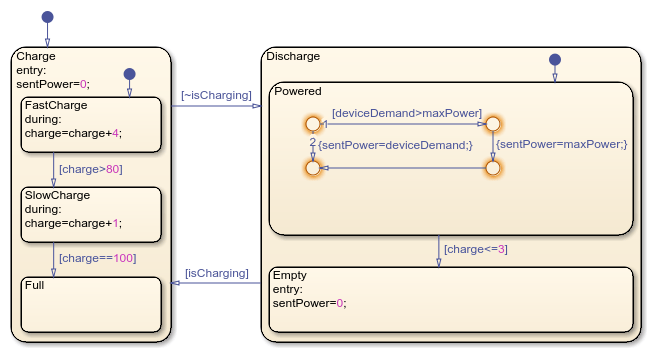
Añada una ruta que represente la demanda de potencia dentro de los límites de la batería.
Añada una cuarta intersección debajo de la primera.
Represente una transición desde la primera intersección a la cuarta. Añada la acción
{sentPower=deviceDemand;}.Cree una transición desde la tercera intersección a la cuarta.
Los números de la primera intersección indican el orden de evaluación. La transición con la etiqueta [deviceDemand>maxPower] tiene la etiqueta de orden 1, que indica que se evalúa primero. La transición con la etiqueta {sentPower=deviceDemand;} tiene la etiqueta de orden 2, que indica que se evalúa en segundo lugar.
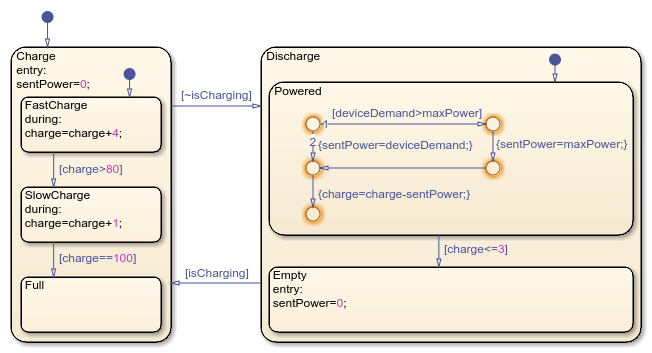
Una intersección terminal es una intersección sin transiciones salientes. Conecte ambas rutas a una intersección terminal compartida. En la transición a la intersección terminal, disminuya la carga de la batería en proporción a la potencia de salida.
Añada una quinta intersección debajo de la cuarta.
Cree una transición desde la cuarta intersección a la quinta. Añada la acción
{charge=charge-sentPower;}.
Evaluar durante los pasos activos con transiciones internas
Las transiciones internas son el equivalente gráfico de una acción during. Cuando un estado contiene una transición interna, dicha transición se evalúa en cada paso mientras el estado permanece activo, pero no en pasos en los que el estado se activa o se desactiva. Si un estado contiene transiciones internas y transiciones entre estados secundarios, las transiciones internas se evalúan primero. Puede crear una transición interna representando una transición desde el borde de un estado hasta un objeto dentro de ese estado.
Represente una transición interna desde el borde del estado Powered hasta la primera intersección.
Definir datos de gráficos
Defina los datos creados en el diagrama de flujo.
En el panel Symbols, en la fila
maxPower, en Type, haga clic en el icono y seleccioneLocal Data. Establezca Value en3.5.En la fila
deviceDemand, en Type, haga clic en el icono y seleccioneInput Data.En la fila
charge, establezca Value en100.

Añada un bloque que se conecta al puerto de entrada deviceDemand.
Abra el modelo de nivel superior.
Añada un bloque Sine Wave. Conecte el puerto de salida al puerto deviceDemand del gráfico
Battery.Especifique que la onda sinusoidal comience en
0y alcance un valor máximo de5. Haga doble clic en el bloque para abrir el cuadro de diálogo del bloque y, después, establezca los parámetros Amplitude y Bias en2.5. Establezca el parámetro Phase en-pi/4.Haga clic con el botón secundario en la línea de conexión desde el bloque Sine Wave hasta el gráfico
Batteryy haga clic en Log selected signals. Repita este paso para la línea de conexión desde el gráficoBatteryhasta el bloque Scope.
Simular el modelo
Simule el modelo y observe los resultados.
Para simular el modelo, en la pestaña Simulation, haga clic en Run.
Para abrir Simulation Data Inspector, en la pestaña Simulation, haga clic en Data Inspector.
En la pestaña Inspect, seleccione
Battery:1ySine Wave:1.
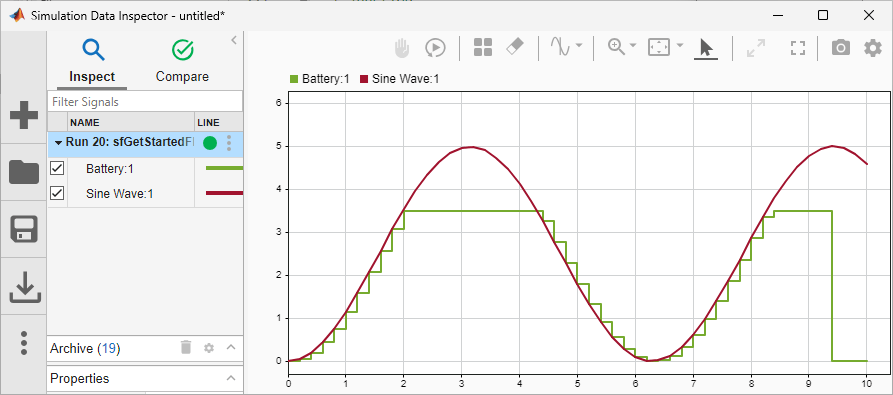
La potencia de salida de la batería coincide con el aumento y disminución de la demanda de energía, hasta un máximo de 3.5. Cerca del final de la simulación, la batería se agota y la potencia de salida desciende a 0.
El sistema de baterías genera potencia según lo esperado. No obstante, si la batería se agota, el sistema ya no puede funcionar.
En el siguiente paso del tutorial, se añade una batería de emergencia no recargable que mantiene las funciones esenciales si la batería principal se agota. Para modelar el funcionamiento simultáneo de las baterías, se usan estados paralelos y eventos.