Crear modos de funcionamiento principales y secundarios
En gráficos de Stateflow®, puede crear modos de funcionamiento anidados colocando un estado dentro del borde de un estado existente. El estado existente se denomina un estado principal y los estados que contiene se denominan estados secundarios.
El contenido del estado principal actúa como un gráfico más pequeño. De modo similar a un gráfico, el estado principal contiene una transición predeterminada. Cuando el estado principal se activa, también se activa el estado secundario conectado a la transición predeterminada. Después, el gráfico realiza transiciones entre los estados secundarios. Cuando el estado principal se desactiva, también se desactivan los estados secundarios.
Por ejemplo, en este modelo de las luces de emergencia de una ambulancia, el estado On tiene los estados secundarios Red y White. Cuando On se activa, la ambulancia alterna las luces de colores, comenzando con el estado Red. Cuando On se desactiva, ambas luces se desactivan.
En este ejemplo, puede utilizar estados secundarios para modelar las velocidades de carga variables de un sistema de baterías recargables.
Abrir el modelo
El modelo sfGetStartedBattery representa la lógica de control para un sistema de baterías recargables. Para construir el modelo, siga las instrucciones de los pasos anteriores del tutorial.
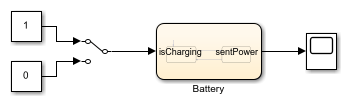
Haga doble clic en el bloque Chart para entrar en el gráfico de la batería.
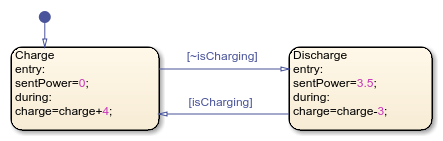
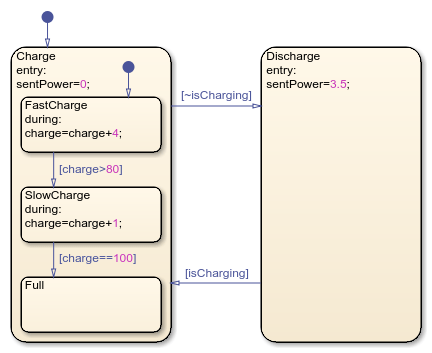
Los estados Charge y Discharge representan los modos de funcionamiento del sistema de baterías. Los datos de entrada isCharging determinan el estado activo. Los datos de salida sentPower y los datos locales charge representan la potencia de salida y el nivel de carga de la batería.
Añadir estados secundarios a una jerarquía de modelo
Actualmente, el sistema de baterías continúa cargándose cuando está lleno y descargándose cuando está vacío. Para representar los modos de carga completo, vacío e intermedio, el sistema de baterías requiere modos de funcionamiento adicionales:
| Modo principal | Modo secundario | Acciones | Condición de salida |
|---|---|---|---|
Charge | FastCharge | Cuando está activo, el nivel de carga aumenta a una velocidad del 4% | Cuando el nivel de carga es superior al 80%, pasa a SlowCharge |
Charge | SlowCharge | Cuando está activo, el nivel de carga aumenta a una velocidad del 1% | Cuando el nivel de carga es igual al 100%, pasa a Full |
Charge | Full | Ninguna | Ninguna |
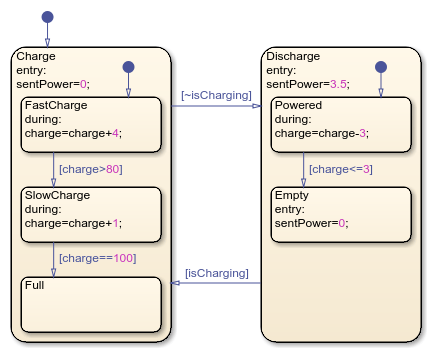
Discharge | Powered | Cuando está activo, el nivel de carga disminuye a una velocidad del 3% | Cuando el nivel de carga es inferior o igual al 3%, pasa a Empty |
Discharge | Empty | Al entrar en este modo, la potencia de salida se establece en 0 | Ninguna |
Añada un estado que represente la carga rápida.
En los estados
ChargeyDischarge, elimine las accionesduring.Expanda los estados
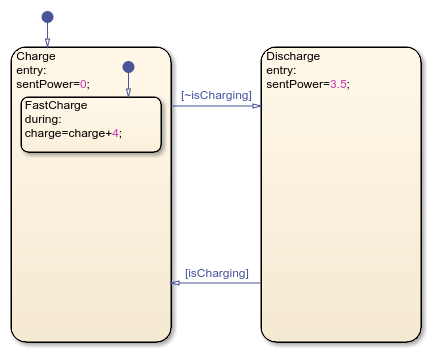
ChargeyDischargepara que puedan contener hasta tres estados secundarios. Para cambiar el tamaño de un estado, haga clic en cualquier esquina y arrástrela hacia afuera.En
Charge, añada un estado secundario denominadoFastCharge. Los estados secundarios deben estar incluidos por completo en el estado principal. Los bordes del estado principal y los estados secundarios no pueden superponerse.En
FastCharge, añada una acciónduringque incremente los datoschargeen4.
Añada dos estados que representen la carga lenta y pausada.
Añada un estado secundario denominado
SlowCharge. Añada una acciónduringque incrementechargeen1.Cree una transición de
FastChargeaSlowChargeque se ejecute cuandochargesupere80.Añada un estado secundario denominado
Full.Añada una transición de
SlowChargeaFullque se ejecute cuandochargesea igual a100.
Añada dos estados que representen la descarga normal y pausada.
En
Discharge, añada un estado secundario denominadoPowered. Añada una acciónduringque disminuyachargeen3.Añada otro estado secundario denominado
Empty. Añada una acciónentryque establezcasentPoweren0.Añada una transición entre
PoweredyEmptyque se ejecute cuandochargees inferior o igual a3.
Simular el modelo
Observe cómo el gráfico realiza transiciones entre los estados secundarios.
En Simulink Editor, asegúrese de que el bloque Manual Switch está establecido en
1.En la pestaña Simulation, haga clic en Run para simular el modelo. En el primer paso, tanto
ChargecomoFastChargeestán activos. A medida quechargeaumenta, el gráfico pasa a los estados secundariosSlowChargeyFull. En el panel Symbols,chargenunca supera100.Regrese al modelo de Simulink de nivel superior. Alterne el valor del bloque Manual Switch haciendo doble clic en el bloque.
Entre en el gráfico. El gráfico activa el estado
Dischargey el estado secundarioPowered. Cuandochargedisminuye por debajo de3, el gráfico realiza la transición dePoweredaEmpty. En el panel Symbols,chargenunca es inferior a0.
El modelo de batería ahora es más realista. Sin embargo, el diseño sigue teniendo problemas. Por ejemplo, si el dispositivo conectado requiere menos de 3,5 vatios de potencia, la salida de la batería no cambia.
En el siguiente paso del tutorial, creará un diagrama de flujo que varía la salida de potencia del sistema de baterías en función de la demanda del dispositivo conectado.