maineffectsplot
Main effects plot for grouped data
Description
maineffectsplot(
specifies additional options using one or more name-value arguments. For example, you can
specify the grouping variable names, and the statistic to plot.Y,group,Name=Value)
Examples
Load the carsmall data set.
load carsmall;Create a main effects plot for car weight with two grouping variables: model year and number of cylinders.
maineffectsplot(Weight,{Model_Year,Cylinders}, ...
               VarNames=["Model Year","# of Cylinders"])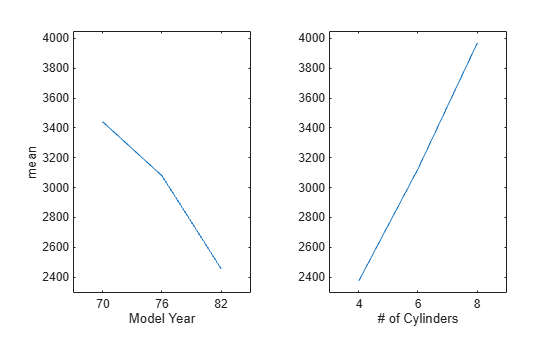
The first subplot shows that mean car weight decreases with increasing model year. The second subplot shows that mean car weight sharply increases with the number of cylinders.
Load the carsmall data set.
load carsmall;Create a matrix Y that contains the Weight predictor data and four simulated sets of noisy Weight observations.
rng(0,"twister") % For reproducibility
noise_std = 10;
Y = [Weight, ...
    Weight+noise_std*randn(size(Weight)), ...
    Weight+noise_std*randn(size(Weight)), ...
    Weight+noise_std*randn(size(Weight)), ...
    Weight+noise_std*randn(size(Weight))];
Create a main effects plot for the car weight observations with two grouping variables, model year and number of cylinders. Plot the standard deviation of the observations.
maineffectsplot(Y,{Model_Year,Cylinders},Statistic="std", ...
               VarNames=["Model Year","# of Cylinders"])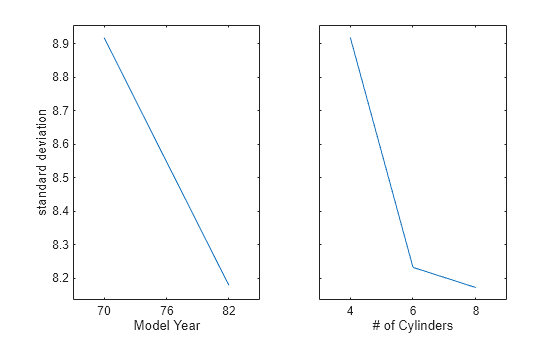
The subplots show that the standard deviation of the car weight decreases with both the model year and number of cylinders.
Input Arguments
Name-Value Arguments
Output Arguments
Version History
Introduced in R2006b