multivarichart
Multivari chart for grouped data
Syntax
Description
multivarichart(
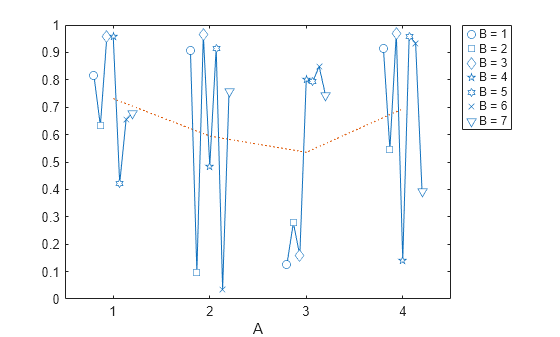
creates a multivari chart for the vector y,group)y with groups defined by the
entries in group. Each subplot of the plot matrix contains a multivari
chart for the first and second grouping variables. The x-axis in each
subplot contains the values of the first grouping variable. The legend at the bottom of the
figure window identifies the values of the second grouping variable. The subplot at position
(i,j) is the multivari chart for the subset of
y at the ith level of the third grouping
variable and the jth level of the fourth grouping variable. If the
third or fourth grouping variable is absent, multivarichart assumes that
the variable has only one level.
multivarichart( displays a multivari chart
for the n-by-m matrix Z)Z. The
first row of Z contains data for the m values of the
second grouping variable that correspond to the first value of the first grouping variable.
The remaining rows of Z contain data corresponding to the other
n–1 values of the first grouping variable. The first
grouping variable has integer values from 1 to n, and
the second grouping variable has integer values from 1 to
m.
multivarichart(___,
specifies options using one or more name-value arguments in addition to any of the input
argument combinations in the previous syntaxes. For example, you can specify the grouping
variable names and the plot order.Name=Value)

