comm.PhaseNoise
Apply phase noise to baseband signal
Description
The comm.PhaseNoise
System object™ adds phase noise to a complex signal. This object emulates impairments
introduced by the local oscillator of a wireless communication transmitter or receiver. The
object generates filtered phase noise according to the specified spectral mask and adds it to
the input signal. For a description of the phase noise modeling, see Algorithms.
To add phase noise using a comm.PhaseNoise object:
Create the
comm.PhaseNoiseobject and set its properties.Call the object with arguments, as if it were a function.
To learn more about how System objects work, see What Are System Objects?
Creation
Syntax
Description
phznoise = comm.PhaseNoise
phznoise = comm.PhaseNoise(level,offset,samplerate)
phznoise = comm.PhaseNoise(___,Name=Value)comm.PhaseNoise(RandomStream="mt19937ar with seed"), creates a phase
noise object with the random stream set to use the Mersenne Twister random number
generator.
Properties
Usage
Syntax
Description
Input Arguments
Output Arguments
Object Functions
To use an object function, specify the
System object as the first input argument. For
example, to release system resources of a System object named obj, use
this syntax:
release(obj)
Examples
Add a phase noise vector and frequency offset vector to a 16-QAM signal. Then plot the signal.
Create a phase noise System object.
pnoise = comm.PhaseNoise('Level',-50,'FrequencyOffset',20);
Generate modulated symbols.
M = 16; % From 16-QAM
data = randi([0 M-1],1000,1);
modData = qammod(data,M);
Use pnoise to apply phase noise. Plot the impaired data.
y = pnoise(modData);
scatterplot(y)

View the effects of phase noise on a 10 MHz sine wave by using a spectrum analyzer. Adjust the resolution bandwidth of the spectrum analyzer to see its impact on the visualized spectral noise.
Initialize variables for the simulation.
fc = 1e6; % Carrier frequency in Hz
fs = 4e6; % Sample rate in Hz.
phNzLevel = [-85 -118 -125 -145]; % in dBc/Hz
phNzFreqOff = [1e3 9.5e3 19.5e3 195e3]; % in Hz
Nspf = 6e6; % Number of Samples per frame
freqSpan = 400e3; % in Hz, for spectrum computation
Create sine wave, phase noise, and spectrum analyzer objects.
sinewave = dsp.SineWave( ...
    Amplitude=1, ...
    Frequency=fc, ...
    SampleRate=fs, ...
    SamplesPerFrame=Nspf, ...
    ComplexOutput=true);
pnoise = comm.PhaseNoise( ...
    Level=phNzLevel, ...
    FrequencyOffset=phNzFreqOff, ...
    SampleRate=fs);
sascopeRBW100 = spectrumAnalyzer( ...
    SampleRate=fs, ...
    Method="welch", ...
    FrequencySpan="Span and center frequency", ...
    CenterFrequency=fc, ...
    Span=freqSpan, ...
    RBWSource="Property", ...
    RBW=100, ...
    SpectrumType="Power density", ...
    SpectrumUnits="dBW", ...
    YLimits=[-150 10], ...
    Title="Resolution Bandwidth 100 Hz", ...
    ChannelNames={'signal','signal with phase noise'}, ...
    Position=[79 147 605 374]);
sascopeRBW1k = spectrumAnalyzer( ...
    SampleRate=fs, ...
    Method="welch", ...
    FrequencySpan="Span and center frequency", ...
    CenterFrequency=fc, ...
    Span=freqSpan, ...
    RBWSource="Property", ...
    RBW=1000, ...
    SpectrumType="Power density", ...
    SpectrumUnits="dBW", ...
    YLimits=[-150 10], ...
    Title="Resolution Bandwidth 1 kHz", ...
    ChannelNames={'signal','signal with phase noise'}, ...
    Position=[685 146 605 376]);
To analyze the spectrum and phase noise, the example includes two spectrum analyzer objects, with 100 Hz and 1 kHz resolution bandwidths, respectively. The spectrum analyzer objects use the default Hann windowing setting, the spectrum units are set to dBW, and the number of spectral averages is set to 10.
x = sinewave();
y = pnoise(x);
When the resolution bandwidth is 100 Hz, the dBW/Hz view for the spectrum analyzer shows the tone at -20 dBW/Hz. The spectrum analyzer object corrects for the power spreading effect of the Hann windowing. Results show the visual average of the phase noise match the specified phase noise spectrum.
sascopeRBW100(x,y)

When the resolution bandwidth is 1 kHz, the dBW/Hz view for the spectrum analyzer shows the tone at -30 dBW/Hz. The tone energy of the sine wave is now spread across 1 kHz instead of 100 Hz, so the sine wave PSD level reduces by 10 dB. With the resolution bandwidth at 1 kHz, the visual average of the phase noise still achieves the phase noise defined by the phase noise object.
With the resolution bandwidth increased from 100 Hz to 1 kHz, the spectrum analyzer object still corrects for the power spreading effect of the Hann window, and it achieves better spectral averaging with the wider resolution bandwidth. For more information, see Why Use Windows?
sascopeRBW1k(x,y)

Calculate the RMS phase noise in degrees between the pure and noisy sine waves. In the general case, the pure signal must be time aligned with the noisy signal to accurately determine the phase error. However, in this case, the periodicity of the sine wave makes this step unnecessary.
ph_err = unwrap(angle(y) - angle(x));
rms_ph_nz_deg = rms(ph_err)*180/pi();
sprintf('The computed RMS phase noise is %3.2f degrees.', ...
    rms_ph_nz_deg)
ans =
'The computed RMS phase noise is 0.37 degrees.'
Algorithms
The output signal, yk, is related to input sequence xk by yk=xkejφk, where φk is the phase noise. The phase noise is filtered Gaussian noise such that φk=f(nk), where nk is the noise sequence and f represent a filtering operation.

To model the phase noise, define the power spectrum density (PSD) mask characteristic by specifying scalar or vector values for the frequency offset and phase noise level.
For a scalar frequency offset and phase noise level specification, an IIR digital filter computes the spectrum mask. The spectrum mask has a 1 / f characteristic that passes through the specified point. For more information, see IIR Digital Filter.
For a vector frequency offset and phase noise level specification, an FIR filter computes the spectrum mask. The spectrum mask is interpolated across log10(f). For more information, see FIR Filter.
For the FIR filter, the phase noise level is determined through log10(f) interpolation for frequency offsets over the range [df, fs /
2], where df is the frequency resolution and
fs is the sample rate. The phase noise is flat
over the range [0, df] in Hz, and from the largest frequency offset to fs / 2. The phase noise has 1 / f3 characteristic from df to the smallest frequency
offset. The phase noise is linearly interpolated between the smallest and the largest
frequency offset. The frequency resolution is equal to (fs / 2)(1 /
Nt), where Nt is the number of
coefficients, and is a power of 2 less than or equal to
216.
Use a time domain FIR filter if the number of taps,
Nt, of the resulting filter is less than
28. Use a frequency domain FIR filter if
28 <=
Nt <=
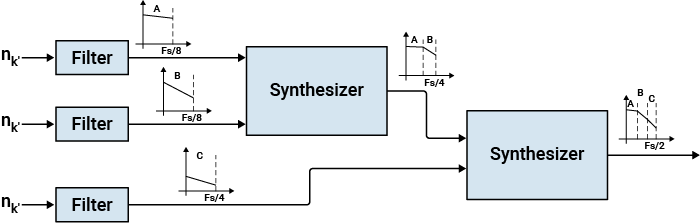
216. Use a cascaded system of filters and
synthesizers if Nt >
216. Divide the [0,
fs/2] frequency range into two equal
halves. Design a filter to shape the phase noise in each sub band. Combine the two sub bands
using a synthesizer that results in the desired phase noise characteristics over the [0,
fs/2] range. Repeat this process for each
sub band of each filter is less than or equal
to216.
The single filter, or the cascaded filter-synthesizer system, is primed during initialization to remove filter latency.
References
[1] Kasdin, N. J. "Discrete Simulation of Colored Noise and Stochastic Processes and 1/(f^alpha); Power Law Noise Generation." The Proceedings of the IEEE® 83, no. 5 (May, 1995): 802–27.