view
Plot computed poles and zeros when using zero-pole truncation method
Since R2025a
Description
view( plots the computed poles and zeros
when using zero-pole truncation method.R)
view(___,Parent= creates
a plot in the specified parent graphics container, such as a parent)Figure or
TiledChartLayout. Use this syntax when you want to create a plot in a
specified open figure or when creating apps in App Designer. You can specify
the parent container after any of the input argument combinations in the previous
syntaxes.
Examples
This example shows how to customize the plot of pole-zero map for input-output pairs obtained using the view function. You use the view function to analyze the pole-zero map of the approximated zpk model when using zero-pole truncation method.
Generate a random sparse state-space model with 15 states, 2 outputs, and 2 inputs.
rng(0)
sys = sparss(rss(15,2,2));
Create a model reduction object using zero-pole truncation method, specify the required frequency band of interest, and compute the information.
R = reducespec(sys,'zpk');
R.Options.Focus = [0 2];
R.Options.Display = 'off';
R = process(R);
You can now visualize the pole-zero map of the approximated model.
view(R)
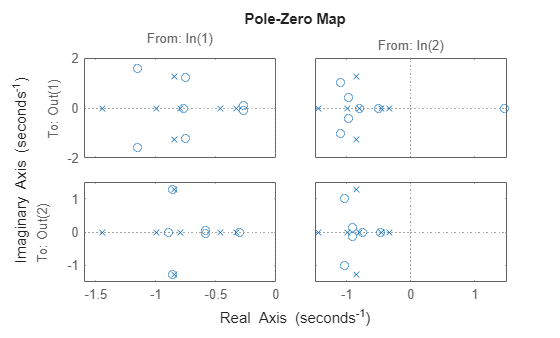
The function produces a map of poles and zeros corresponding to each input-output channel. When you specify an output argument with view, the function returns an IOPZPlot chart object. To customize the appearance of the plot, you can modify the properties of this object. For example, modify the chart object to view all I/Os on a single axis.
h = view(R);
h.IOGrouping = "all";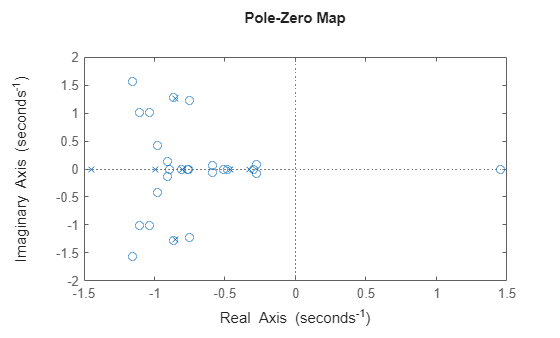
Input Arguments
Output Arguments
Version History
Introduced in R2025a