Anatomy of the Imatest Extended eSFR Chart
The Imatest® edge spatial frequency response (eSFR) test charts contain visual features that enable sharpness measurements according to the ISO 12233:2014 standard [1], [2]. You can use a single test chart to measure chromatic aberration, noise, and scene illumination. Registration markers on the chart enable automatic selection of regions of interest (ROIs) for measurements.
Image Processing Toolbox™ supports the Enhanced and Extended versions of the eSFR test chart. The
Extended version has a 16:9 aspect ratio and additional features to measure color
accuracy. The esfrChart
object does not analyze other visual features in the chart, such as focusing targets and
wedges.
Slanted Edge Features
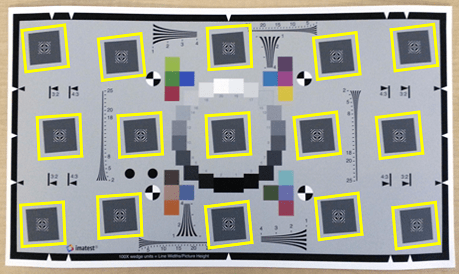
The Extended eSFR test chart has 15 gray boxes tilted 5° away from vertical. The left, top, right, and bottom edges of each box are used to measure:
Local SFR, which indicates image sharpness. Sharp edges have better contrast than blurry edges, and they more clearly show the actual position of the edge.
In sharp edges, pixel intensity values quickly transition across boundaries in the scene. Most pixels clearly belong to one side of the boundary or the other, and few pixels have intermediate values. The contrast is high because adjacent pixels on either side of the actual edge have large differences in intensity.
In blurry edges, the transition happens gradually over many pixels, which makes it unclear where the boundary actually occurs. The contrast is low because adjacent pixels have similar intensity values.
Sharpness is higher toward the center of the imaged region and decreases toward the periphery. Horizontal sharpness is usually higher than vertical sharpness. To measure SFR, use the
measureSharpnessfunction.Local chromatic aberration, or color fringing, which indicates how uniformly the camera optical system focuses light in the red, green, and blue color channels. In captured images, chromatic aberration appears as an artificial strip of color along edges. Chromatic aberration also lowers contrast in the luminance channel, and therefore reduces image sharpness.
Chromatic aberration increases radially from the center of the image. To measure chromatic aberration, use the
measureChromaticAberrationfunction. This function also returns the edge profiles for each color channel, which is the averaged projection of pixel intensity values along the edge.
If you capture an image of the test chart at the full 16:9 aspect ratio, then
esfrChart automatically identifies and labels all 60 available
slanted-edge ROIs. You can also image the test chart at the 4:3 and 3:2 aspect
ratios, as indicated on the chart. At these ratios, fewer edges are available, and
esfrChart indexes edges according to the convention used by the 16:9
aspect ratio.
In a proper capture of the test chart, orient the chart without rotation, so that the angle of the slanted edges is close to 5°. The contrast of the edges must be greater than 20%. If the contrast is less than 20%, adjust the scene lighting and the camera exposure.
Gray Patch Features
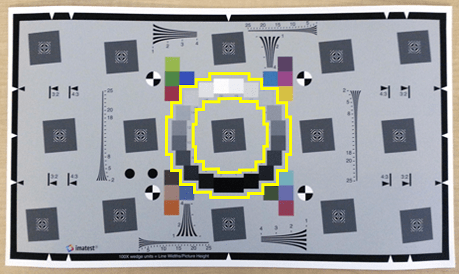
The Extended eSFR test chart has 20 gray patches of increasing brightness, arranged in a ring around the center of the image. The gray patches are used to measure:
Scene illumination, which estimates the color of the light illuminating the scene. You can use the measured illumination to white-balance images acquired under similar lighting conditions. To measure scene illumination, use the
measureIlluminantfunction. To white-balance the image, usechromadapt.Noise, which quantifies how much the camera electronics generate error in pixel values. To estimate noise in each color channel, use the
measureNoisefunction.
In a proper capture of the test chart, set the scene lighting and camera exposure so that each gray patch appears distinct from the other patches and no pixels are clipped. If the darkest patches appear identical, or have values of 0, increase the scene lighting or the exposure. If the brightest patches appear identical, or if the brightest patch is saturated, decrease the scene lighting or the exposure.
Color Patch Features
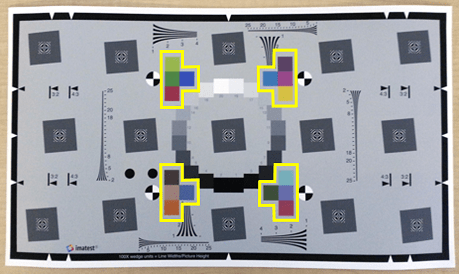
The Extended eSFR test chart has 16 color patches arranged in four groups. The color patches are used to measure:
Color accuracy, which indicates how well the measured red, green, and blue values agree with expected color values. To measure color accuracy, use the
measureColorfunction. This function also returns a color correction matrix, which you can use to adjust the image colors toward the expected values.
Registration Markers
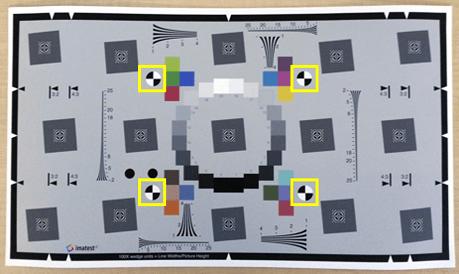
The eSFR test charts have registration markers used to orient the image properly.
When you import a chart, esfrChart detects four black-and-white checkered circles and uses
their position to define regions of interest automatically. You can optionally
specify the [x, y] coordinates of the circle centers manually.