fimplicit3
R2026bPlot 3-D implicit function

Syntax
Description
fimplicit3( plots
the 3-D implicit function defined by f)f(x,y,z) = 0 over
the default interval [-5 5] for x, y,
and z.
fimplicit3( plots
into the axes specified by ax,___)ax instead of into the
current axes. Specify the axes as the first input argument, prior
to any of the previous input arguments.
fimplicit3(___, specifies the
line style, marker symbol, and line color. For example, LineSpec)"-r"
specifies red lines.
fimplicit3(___, specifies
surface properties using one or more name-value arguments. For example,
Name=Value)FaceAlpha=0.6 specifies a transparency value of
0.6 for a semi-transparent surface.
fs = fimplicit3(___)ImplicitFunctionSurface object. Use fs to
access and modify properties of the surface after it is created. For
a list of properties, see ImplicitFunctionSurface Properties.
Examples
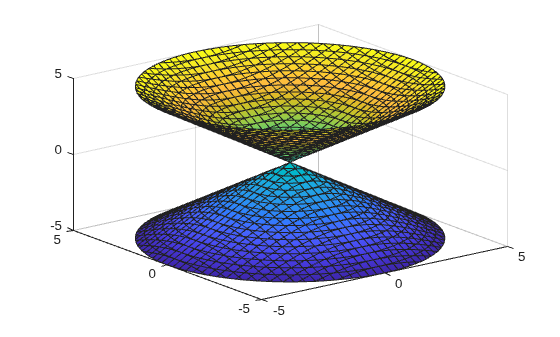
Plot the hyperboloid over the default interval of for x, y, and z.
f = @(x,y,z) x.^2 + y.^2 - z.^2;
fimplicit3(f)
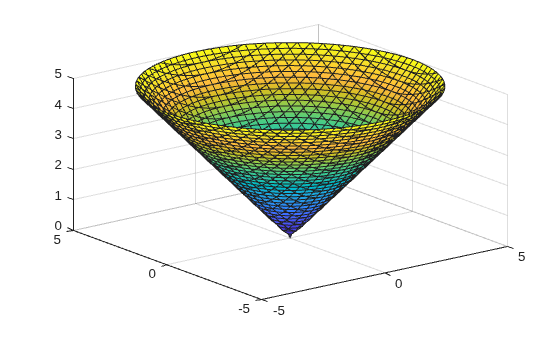
Plot the upper half of the hyperboloid by specifying the plotting interval as [0 5] for z. For x and y, use the default interval [-5 5].
f = @(x,y,z) x.^2 + y.^2 - z.^2;
interval = [-5 5 -5 5 0 5];
fimplicit3(f,interval)
Plot the implicit surface . Remove the lines by setting the EdgeColor property to 'none'. Add transparency by setting the FaceAlpha property to a value between 0 and 1.
f = @(x,y,z) x.^2 + y.^2 - z.^2;
fimplicit3(f,EdgeColor="none",FaceAlpha=.5)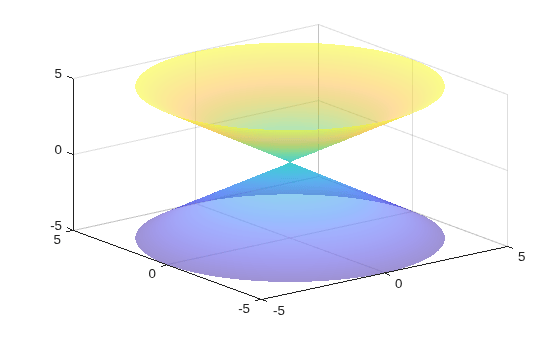
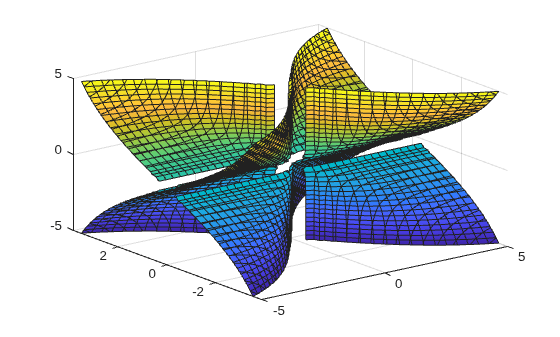
Plot an implicit surface and assign the implicit surface object to the variable fs.
f = @(x,y,z) 1./x.^2 - 1./y.^2 + 1./z.^2;
fs = fimplicit3(f)
fs =
  ImplicitFunctionSurface with properties:

     Function: @(x,y,z)1./x.^2-1./y.^2+1./z.^2
    EdgeColor: [0.1294 0.1294 0.1294]
    LineStyle: '-'
    FaceColor: 'interp'

  Show all properties
Use fs to access and modify properties of the implicit surface after it is created. For example, show only the positive x values by setting the XRange property to [0 5]. Remove the lines by setting the EdgeColor property to "none". Add transparency by setting the FaceAlpha property to 0.8.
fs.XRange = [0 5];
fs.EdgeColor = "none";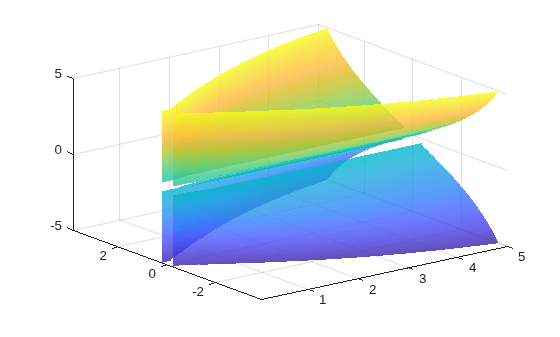
fs.FaceAlpha = 0.8;
Input Arguments
3-D implicit function to plot, specified as a function handle to a named or anonymous function.
Specify a function of the form w = f(x,y,z).
The function must accept three 3-D array input arguments and return
a 3-D array output argument of the same size. Use array operators
instead of matrix operators for the best performance. For example,
use .* (times) instead of
* (mtimes).
Example: fimplicit3(@(x,y,z) x.^2 + y.^2 - z.^2)
Plotting interval for x, y,
and z, specified in one of these forms:
Two-element vector of form
[min max]— Use the same plotting interval of[min max]forx,y, andz.Six-element vector of form
[xmin xmax ymin
ymax zmin zmax]
— Use different plotting intervals forx,y, andz. Plot over the interval[xmin xmax]forx, over[ymin ymax]fory, and over[zmin zmax]forz.
Example: fimplicit3(f,[-2 3 -4 5 -3 3])
Line style, marker, and color, specified as a string scalar or character vector containing symbols. The symbols can appear in any order. You do not need to specify all three characteristics (line style, marker, and color). For example, if you omit the line style and specify the marker, then the plot shows only the marker and no line.
Example: "--or" is a red dashed line with circle markers.
| Line Style | Description | Resulting Line |
|---|---|---|
"-" | Solid line |
|
"--" | Dashed line |
|
":" | Dotted line |
|
"-." | Dash-dotted line |
|


| Marker | Description | Resulting Marker |
|---|---|---|
"o" | Circle |
|
"+" | Plus sign |
|
"*" | Asterisk |
|
"." | Point |
|
"x" | Cross |
|
"_" | Horizontal line |
|
"|" | Vertical line |
|
"square" | Square |
|
"diamond" | Diamond |
|
"^" | Upward-pointing triangle |
|
"v" | Downward-pointing triangle |
|
">" | Right-pointing triangle |
|
"<" | Left-pointing triangle |
|
"pentagram" | Pentagram |
|
"hexagram" | Hexagram |
|


| Color Name | Short Name | RGB Triplet | Appearance |
|---|---|---|---|
"red" | "r" | [1 0 0] |
|
"green" | "g" | [0 1 0] |
|
"blue" | "b" | [0 0 1] |
|
"cyan"
| "c" | [0 1 1] |
|
"magenta" | "m" | [1 0 1] |
|
"yellow" | "y" | [1 1 0] |
|
"black" | "k" | [0 0 0] |
|
"white" | "w" | [1 1 1] |
|


Axes object. If you do not specify the axes, then fimplicit3 uses
the current axes.
Name-Value Arguments
Specify optional pairs of arguments as
Name1=Value1,...,NameN=ValueN, where Name is
the argument name and Value is the corresponding value.
Name-value arguments must appear after other arguments, but the order of the
pairs does not matter.
Example: fimplicit3(f,MeshDensity=50,FaceAlpha=0.5) specifies the number of
evaluation points and a transparency value.
The ImplicitFunctionSurface properties listed
here are only a subset. For a complete list, see ImplicitFunctionSurface Properties.
Number of evaluation points per direction, specified as a scalar.
This table lists the default color palettes for plots in the light and dark themes.
| Palette | Palette Colors |
|---|---|
Before R2025a: Most plots use these colors by default. |
|
|
|


You can get the RGB triplets and hexadecimal color codes for these palettes using the orderedcolors and rgb2hex functions. For example, get the RGB triplets for the "gem" palette and convert them to hexadecimal color codes.
RGB = orderedcolors("gem");
H = rgb2hex(RGB);
Before R2024a: Get the hexadecimal color codes using
H = compose("#%02X%02X%02X",round(RGB*255)).
Before R2023b: Get the RGB triplets using RGB =
get(groot,"FactoryAxesColorOrder").
This table lists the default color palettes for plots in the light and dark themes.
| Palette | Palette Colors |
|---|---|
Before R2025a: Most plots use these colors by default. |
|
|
|
You can get the RGB triplets and hexadecimal color codes for these palettes using the orderedcolors and rgb2hex functions. For example, get the RGB triplets for the "gem" palette and convert them to hexadecimal color codes.
RGB = orderedcolors("gem");
H = rgb2hex(RGB);
Before R2024a: Get the hexadecimal color codes using
H = compose("#%02X%02X%02X",round(RGB*255)).
Before R2023b: Get the RGB triplets using RGB =
get(groot,"FactoryAxesColorOrder").
Line style, specified as one of the options listed in this table.
| Line Style | Description | Resulting Line |
|---|---|---|
"-" | Solid line |
|
"--" | Dashed line |
|
":" | Dotted line |
|
"-." | Dash-dotted line |
|
"none" | No line | No line |
Tips
Use element-wise operators for the best performance and to avoid a warning message. For example, use
x.*yinstead ofx*y. For more information, see Array vs. Matrix Operations.When you zoom in on the chart,
fimplicit3recalculates the data, which can reveal hidden details.
Version History
Introduced in R2016b

