Analizar la visibilidad de los satélites GPS
Este ejemplo muestra cómo simular y analizar la visibilidad de los satélites GPS en posiciones y horas específicas del receptor utilizando un archivo de almanaque o efemérides GPS. Utilice los controles del script en vivo para configurar varios parámetros para la simulación del satélite.
Especificar parámetros de simulación
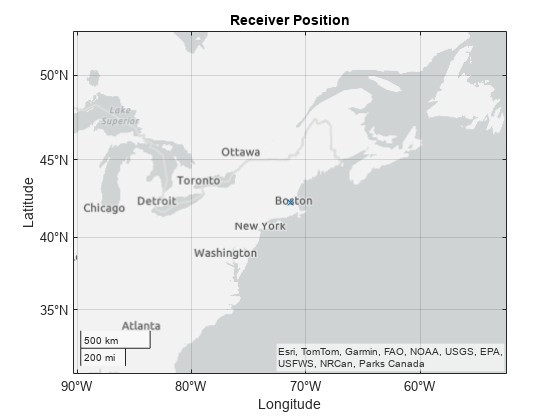
Especifique el tipo de archivo del mensaje de navegación, la hora de inicio, la duración en horas y el tiempo entre muestras en segundos de la simulación. Además, especifique la posición del receptor en coordenadas geodésicas y el ángulo de máscara, o ángulo de elevación mínimo, del receptor.
gnssFileType ="RINEX"; startTime = datetime(2021,06,24,04,00,00); numHours =
24; dt =
60; % s latitude =
42.3013162; % deg longitude =
-71.3782972; % deg altitude =
50; % m recPos = [latitude longitude altitude]; % [deg deg m] maskAngle =
5; % deg
Obtener parámetros orbitales de satélites
Utilice la función auxiliar exampleHelperParseGNSSFile para obtener los parámetros orbitales iniciales del satélite y las ID de los satélites de un archivo GNSS. Debido a que los datos de efemérides son válidos durante dos horas antes y después del momento de las efemérides, puede usarlos para determinar las posiciones exactas de los satélites en órbita. Por el contrario, si bien los datos del almanaque son válidos por un período de 90 días, sólo puedes utilizarlos para estimar las posiciones aproximadas de los satélites.
[navmsg,satIDs] = exampleHelperParseGNSSFile(gnssFileType);
Los archivos utilizados en este ejemplo están vinculados a la hora de inicio especificada startTime. Para utilizar diferentes archivos RINEX, utilice los archivos RINEX incluidos en el ejemplo Leer datos de navegación y observación del archivo RINEX . Para ver ejemplos de cómo descargar y usar diferentes archivos de almanaque SEM y YUMA, consulte Leer datos de mensajes de navegación GPS del archivo SEM Almanac y Leer datos de mensajes de navegación GPS del archivo de almanaque YUMA, respectivamente.
Una vez que tenga nuevos datos de efemérides o un archivo de almanaque, actualice la variable file de la función auxiliar exampleHelperParseGNSSFile para el caso que corresponda a su tipo de archivo.
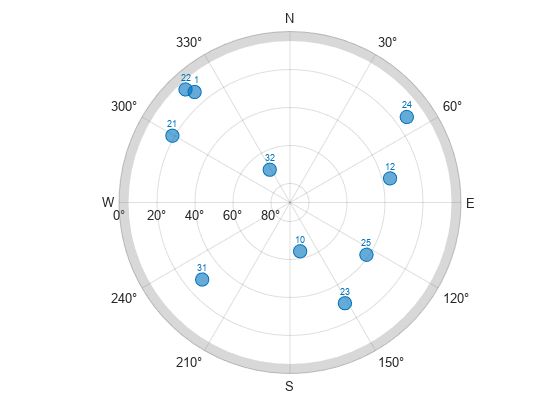
Generar visibilidades satelitales
Usando sus parámetros de simulación, genere las visibilidades de los satélites como una matriz de valores lógicos. Cada fila de la matriz corresponde a un paso de tiempo y cada columna corresponde a un satélite. Para trazar las visibilidades, repita el vector de tiempo mientras calcula las posiciones de los satélites y los ángulos de visión basados en la simulación de la constelación GNSS.
secondsPerHour = 3600;
timeElapsed = 0:dt:(secondsPerHour*numHours);
t = startTime+seconds(timeElapsed);

numSats = numel(satIDs);
numSamples = numel(t);
az = zeros(numSamples,numSats);
el = zeros(numSamples,numSats);
vis = false(numSamples,numSats);

sp = skyplot([],[],MaskElevation=maskAngle);

for ii = 1:numel(t)
    satPos = gnssconstellation(t(ii),navmsg,GNSSFileType=gnssFileType);
    [az(ii,:),el(ii,:),vis(ii,:)] = lookangles(recPos,satPos,maskAngle);
    set(sp,AzimuthData=az(ii,vis(ii,:)), ...
        ElevationData=el(ii,vis(ii,:)), ...
        LabelData=satIDs(vis(ii,:)))
    drawnow limitrate
end
Representar los resultados
Utilice la matriz lógica para generar un gráfico de visibilidad de satélites y trace el número total de satélites visibles en cada paso de tiempo. En general, al menos cuatro satélites deben ser visibles para calcular una solución de posicionamiento.
visPlotData = double(vis);
visPlotData(visPlotData == false) = NaN; % Hide invisible satellites.
visPlotData = visPlotData + (0:numSats-1); % Add space to satellites to be stacked.
colors = colororder;

figure
plot(t,visPlotData,".",Color=colors(1,:))
yticks(1:numSats)
yticklabels(string(satIDs))
grid on
ylabel("Satellite ID")
xlabel("Time")
title("Satellite Visibility Chart")
axis tight
numVis = sum(vis,2);
figure
area(t,numVis)
grid on
xlabel("Time")
ylabel("Number of satellites visible")
title("Number of GPS satellites visible")
axis tight

Función de ayuda
Utilice la función auxiliar exampleHelperParseGNSSFile para obtener los parámetros orbitales iniciales del satélite y las ID de los satélites del archivo GNSS, según el tipo de archivo.
function [navmsg,satIDs] = exampleHelperParseGNSSFile(gnssFileType)
    switch gnssFileType
        case "RINEX"
            file = "GODS00USA_R_20211750000_01D_GN.rnx";
            navmsg = rinexread(file);
            % For RINEX files, extract gps data and use only the first entry for each satellite.
            gpsData = navmsg.GPS;
            [~,idx] = unique(gpsData.SatelliteID);
            navmsg = gpsData(idx,:);
            satIDs = navmsg.SatelliteID;
        case "SEM"
            file = "semalmanac_2021-6-22.al3";
            navmsg = semread(file);
            satIDs = navmsg.PRNNumber;
        case "YUMA"
            file = "yumaalmanac_2021-6-22.alm";
            navmsg = yumaread(file);
            satIDs = navmsg.PRN;
    end
end
You can also select a web site from the following list:
Americas
- América Latina (Español)
- Canada (English)
- United States (English)
Europe
- Belgium (English)
- Denmark (English)
- Deutschland (Deutsch)
- España (Español)
- Finland (English)
- France (Français)
- Ireland (English)
- Italia (Italiano)
- Luxembourg (English)
- Netherlands (English)
- Norway (English)
- Österreich (Deutsch)
- Portugal (English)
- Sweden (English)
- Switzerland
- United Kingdom (English)