paretoplot
Sintaxis
Descripción
paretoplot( crea una gráfica de Pareto de los objetivos de val)val. Si val contiene más de tres objetivos, paretoplot representa los primeros tres objetivos.
h = paretoplot(___), para cualquier sintaxis de entrada anterior, devuelve un identificador h al objeto de dispersión resultante. Utilice h para establecer las propiedades del objeto de dispersión después de su creación.
paretoplot( representa en los ejes con el identificador ax,___)ax.
Ejemplos
Cree y resuelva un problema de optimización multiobjetivo utilizando variables de optimización.
x = optimvar("x",LowerBound=-1,UpperBound=2);
prob = optimproblem;
prob.Objective.obj1 = x^2;
prob.Objective.obj2 = (x-1)^2;
[sol,fval] = solve(prob,Solver="paretosearch");
Solving problem using paretosearch.

Pareto set found that satisfies the constraints.

Optimization completed because the relative change in the volume of the Pareto set
is less than 'options.ParetoSetChangeTolerance' and constraints are satisfied to within
'options.ConstraintTolerance'.
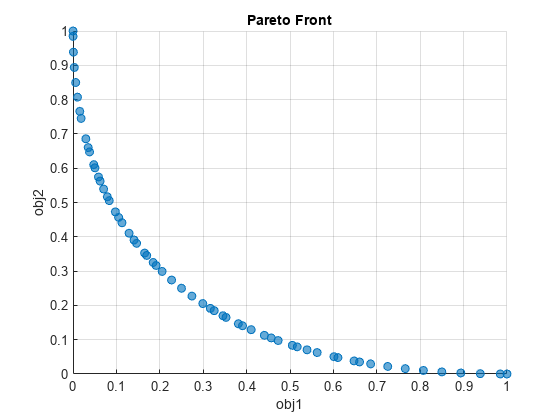
Represente el frente de Pareto.
paretoplot(sol)

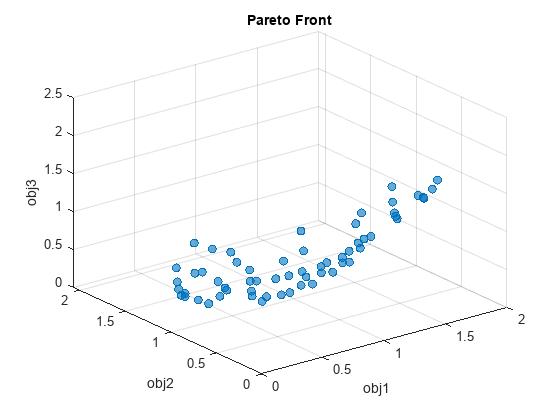
Cree y resuelva un problema de optimización multiobjetivo con cuatro objetivos con nombre.
x = optimvar("x",2,LowerBound=-2,UpperBound=4);
prob = optimproblem;
prob.Objective.obj1 = norm(x)^2;
prob.Objective.obj2 = norm(x - [1;0])^2;
prob.Objective.obj3 = norm(x - [0;1])^2;
prob.Objective.obj4 = norm(x - [1;1])^2;
sol = solve(prob,Solver="paretosearch");
Solving problem using paretosearch.

Pareto set found that satisfies the constraints.

Optimization completed because the relative change in the distance of the Pareto set
is less than 'options.ParetoSetChangeTolerance' and constraints are satisfied to within
'options.ConstraintTolerance'.
Cree una gráfica de Pareto de los primeros tres objetivos;
paretoplot(sol)
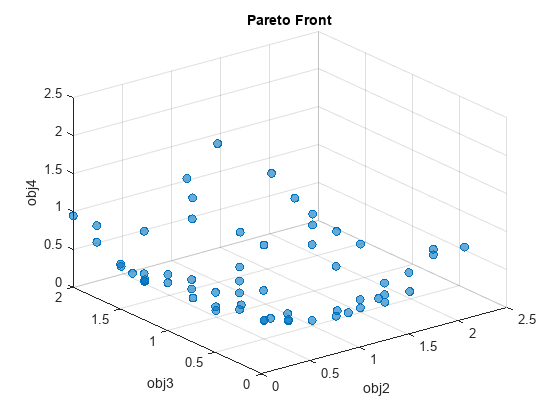
Cree una gráfica de Pareto de los últimos tres objetivos.
paretoplot(sol,["obj2" "obj3" "obj4"])
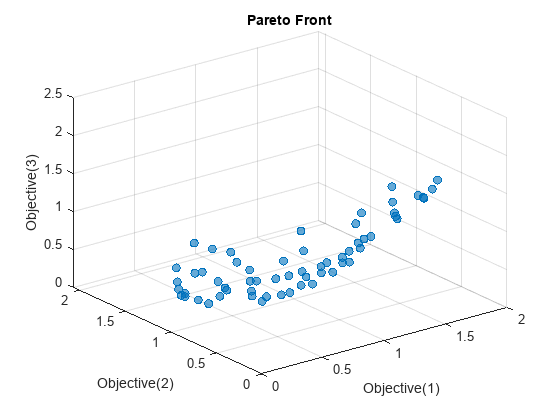
Cree y resuelva un problema de optimización multiobjetivo con cuatro objetivos. La función objetivo devuelve un vector de cuatro elementos.
x = optimvar("x",2,LowerBound=-2,UpperBound=4);
prob = optimproblem;
obj = [norm(x)^2,norm(x - [1;0])^2,norm(x - [0;1])^2,norm(x - [1;1])^2];
prob.Objective = obj;
sol = solve(prob,Solver="paretosearch");
Solving problem using paretosearch.

Pareto set found that satisfies the constraints.

Optimization completed because the relative change in the distance of the Pareto set
is less than 'options.ParetoSetChangeTolerance' and constraints are satisfied to within
'options.ConstraintTolerance'.
Cree una gráfica de Pareto de los primeros tres objetivos;
paretoplot(sol)
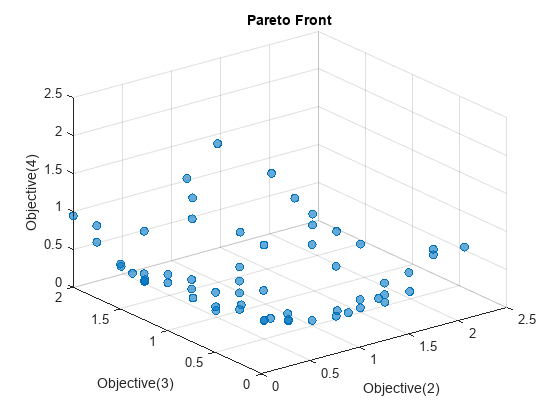
Cree una gráfica de Pareto de los últimos tres objetivos.
paretoplot(sol,[2 3 4])
Cree y resuelva un problema de optimización multiobjetivo utilizando variables de optimización.
x = optimvar("x",LowerBound=-1,UpperBound=2);
prob = optimproblem;
prob.Objective.obj1 = x^2;
prob.Objective.obj2 = (x-1)^2;
[sol,fval] = solve(prob,Solver="paretosearch");
Solving problem using paretosearch.

Pareto set found that satisfies the constraints.

Optimization completed because the relative change in the volume of the Pareto set
is less than 'options.ParetoSetChangeTolerance' and constraints are satisfied to within
'options.ConstraintTolerance'.
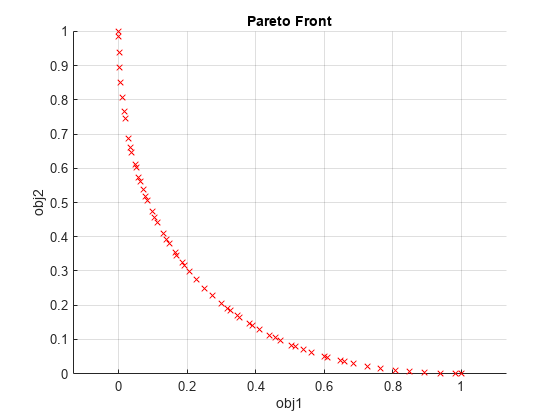
Represente el frente de Pareto. Para habilitar la edición, obtenga un identificador para la gráfica.
h = paretoplot(sol);
Cambie los marcadores de azul 'o' a rojo 'x'. Para obtener una vista no distorsionada, configure los ejes de forma que tengan la misma longitud.
h.Marker = "x";
h.MarkerEdgeColor = "r";
axis equal
Para obtener una lista completa de propiedades editables, consulte Scatter Properties.
Argumentos de entrada
Historial de versiones
Introducido en R2022a
Consulte también
paretosearch (Global Optimization Toolbox) | gamultiobj (Global Optimization Toolbox) | solve
Temas
- Scatter Properties
- Frente de Pareto para optimización multiobjetivo basada en problemas (Global Optimization Toolbox)