pcviewer
R2026bDescription
Use the pcviewer object to view and inspect large 3-D point
clouds. You can interact with the point cloud, and set camera and viewer properties. Point
cloud interactions include navigating through the point cloud, modifying the size of points or
enlarging their display, and selecting viewing planes. Camera and viewer properties enable you
to select between first-person and orbital camera navigation, select a perspective or
orthographic camera projection, and set camera location properties.
Creation
Syntax
Description
viewer = pcviewer( creates a point
cloud viewer that visualizes points stored in the object specified by
ptCloud)ptCloud. You can access and modify point cloud viewer properties
using the returned pcviewer object viewer.
viewer = pcviewer( visualizes
points stored in the file specified by filename)filename.
filename must be a PLY, PCD, LAS, or LAZ file type. LAS/LAZ files
support requires the Point Cloud
Toolbox™.
viewer = pcviewer(___,
specifies the colors with which to visualize the points of the point cloud, in addition to
any combination of input arguments from previous syntaxes.color)
viewer = pcviewer(___,
specifies options using one or more name-value arguments. For example,
Name=Value)VerticalAxis="XUp" sets the x-axis as the vertical
axis in the viewer, with up as positive.
Input Arguments
Point cloud, specified as a pointCloud object. The
viewer uses the Location property of the
input point cloud object to render the position of the points. By default, the
viewer sets the colors of the points from the
Color property of the input pointCloud
object or by applying a colormap based on the z-values from the
Location property of the object.
Filename, specified as a string scalar or a character vector. The file must be provided as a PLY, PCD, LAS, or LAZ file type. formatted file.
LAS/LAZ files support requires the Point Cloud
Toolbox. LAZ files returned by the lasFileWriter object, which facilitates writing point cloud data to
LAS/LAZ formats, are optimized for display. The viewer is also optimized for LAZ files
stored in the Cloud Optimized Point Cloud (COPC) format. For more details, see the
COPC website.
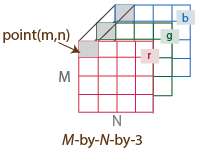
Color for points in the point cloud, specified as an RGB triplet, an
M-by-3 array, or an
M-by-N-by-3 array for an organized point cloud,
a short color name, or a long color name. The color input sets
the Color property. For details on color values, see Color Values table.
If the data type of the point cloud
Locationproperty issingleordouble, eachcolorRGB value must be in the range [0, 1].If the data type of the point cloud
Locationproperty isuint8, eachcolorRGB value must be in the range [0, 255].The
Colorproperty of thepcviewerobject stores thecolorvalue as an RGB triplet, an M-by-3 matrix, or an M-by-N-by-3 array. If you specify the color one or more color names, the function converts them to their corresponding RGB triplets.
| Color | Format | Example |
|---|---|---|
| Specify one color for all points | Short or long color name. |
|
1-by-3 vector (RGB triplet). |
| |
| Specify a color for each point | String array, or cell array of character vectors. |
|
M-by-3 array for an unorganized point cloud, in which each row is an RGB triplet. M is the number of rows in the unorganized point cloud. | 255 0 0 255 0 0 0 255 255 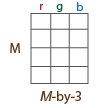 | |
M-by-N-by-3 array for an organized point cloud, in which each page specifies the red, green, or blue value for the corresponding point in the point cloud. M-by-N is the size of the organized point cloud. |
|

Name-Value Arguments
Properties
Object Functions
addCamera | Display camera in point cloud viewer |
addPointCloud | Display point cloud in point cloud viewer |
addShape | Display shape in point cloud viewer |
addSurfaceMesh | Display surface mesh in point cloud viewer |
drawShape | Interactively draw shape in point cloud viewer |
Examples
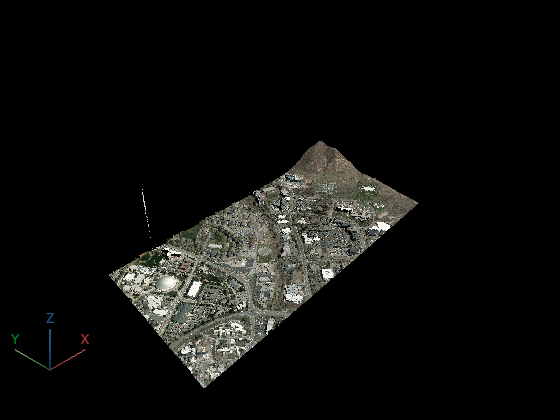
Download two point clouds from the U.S. Geological Survey (USGS) 3D Elevation Program (3DEP) [1], covering the University of Utah campus and adjacent Wasatch Mountain foothills. The combined point cloud contains approximately 21 million RGB points.
baseURL = "https://rockyweb.usgs.gov/vdelivery/Datasets/Staged/Elevation/LPC/Projects/Wasatch_Fault_UT_LiDAR/UT_Wasatch_L4_2013/LAZ/";

tiles = [
    "USGS_LPC_Wasatch_Fault_UT_LiDAR_12TVL2900012000.laz"
    "USGS_LPC_Wasatch_Fault_UT_LiDAR_12TVL3000012000.laz"
];
Read each tile as a point cloud. Download tiles only if they are not already stored locally.
pcArray = pointCloud.empty;
for i = 1:numel(tiles)
    localFile = fullfile(tempdir, tiles(i));
    if ~exist(localFile,"file")
        websave(localFile, baseURL + tiles(i));
    end
    reader = lasFileReader(localFile);
    pcArray(i) = readPointCloud(reader);
end
Concatenate the tiles into a single point cloud.
pc = pccat(pcArray);
Visualize the large point cloud using the pcviewer object.
pcview = pcviewer(pc);
References
[1] USGS Lidar Point Cloud UT_Wasatch_L4_2013 courtesy of the U.S. Geological Survey
More About
This table shows the valid long color names, their short name and RGB triplet equivalents, and how they appear in MATLAB.
| Color Name | Short Name | RGB Triplet | Appearance |
|---|---|---|---|
"red" | "r" | [1 0 0] |
|
"green" | "g" | [0 1 0] |
|
"blue" | "b" | [0 0 1] |
|
"cyan"
| "c" | [0 1 1] |
|
"magenta" | "m" | [1 0 1] |
|
"yellow" | "y" | [1 1 0] |
|
"black" | "k" | [0 0 0] |
|
"white" | "w" | [1 1 1] |
|








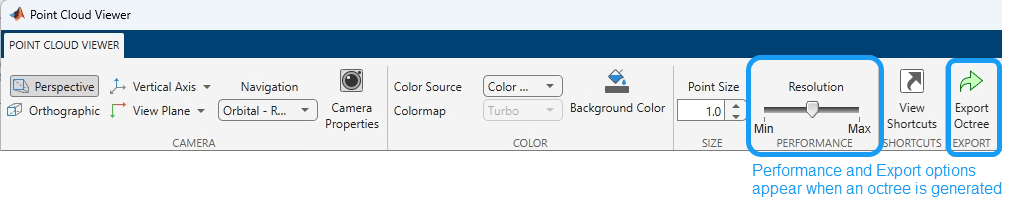
You can expand the viewer toolstrip by clicking the Point Cloud Viewer tab. By default, the toolstrip is collapsed.
| Feature | Viewer Interaction | Description |
|---|---|---|
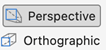
| Camera Projection |
| Projection style of the camera. |
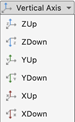
| Vertical Axis |
| Vertical axis and direction, specified by |
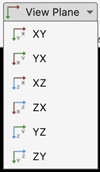
| View Plane |
| Axes plane to display point cloud, specified as |
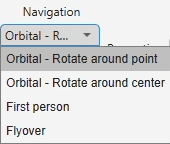
| Navigation |
| View projection used to display the 3-D point cloud, specified as
|
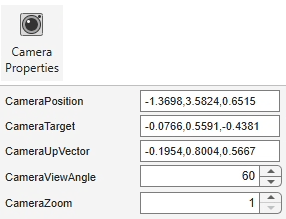
| Camera Properties |
| Set camera location and orientation. The
CameraViewAngle value applies only for the
|
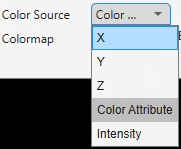
| Color Source |
| Color source from which to render color values for the points. The available options depend on the data in the input point cloud. The options and type of data which you will see them are:
|
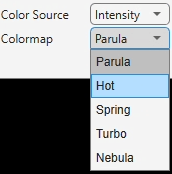
| Colormap |
| Colormap used to render color. When |
| Background Color |
| Viewer background color. |
| Point Size |
| Size of points, in pixels. |
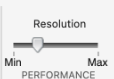
| Resolution |
| Controls the number of points rendered in the viewer. This control is only visible if the point cloud data was optimized using an octree conversion. Increasing the resolution provides greater detail but can decrease interaction performance. |
| View Shortcuts |
| View the point cloud viewer keyboard shortcuts. |
| Export Octree |
| Export optimized point cloud. This file can be reused to visualize the point cloud without needing to regenerate the octree conversion. |



Mouse interactions:
| Behavior | Mouse Interaction |
|---|---|
| Rotate | Left-click and drag |
| Pan | Hold Ctrl, then left-click and drag |
| Zoom | Scroll the wheel |
Axes toolbar:
| Behavior | Mouse Interaction or Interaction after Selection |
|---|---|
| Rotate | Left-click and drag |
| Pan | Left-click and drag |
| Zoom buttons | Scroll wheel |
| Default | Return to view from launch of viewer instance |
Version History
Introduced in R2023aSee Also
Objects
Functions
pcshow|showShape|pcshowpair|plot3|pcread|pcwrite|pcmerge|scatter3|reconstructScene(Computer Vision Toolbox) |triangulate(Computer Vision Toolbox) |pcdownsample|pcfitplane|pcdenoise|pcregistericp|lasFileWriter

