zplane
R2026bPole-zero plot for discrete-time systems
Syntax
Description
zplane(
plots the zeros and poles of discrete-time systems in the current figure window.
Specify the zeros in a column vector z,p)z and the poles in a
column vector p. The symbol 'o'
represents a zero and the symbol 'x' represents a pole. The
plot includes the unit circle for reference.
If z and p are matrices, then
zplane treats each column as a separate set of
poles and zeros, and plots each set in a different color.
zplane( finds and plots the
zeros and poles of the digital filter represented as Cascaded Transfer Functions (CTF) with
numerator coefficients B,A,"ctf")B and denominator coefficients
A. (since R2024b)
Note
Specify the "ctf" option to disambiguate CTF
numerator and denominator matrices B,A from
multiple sets of poles and zeros
z,p.
Examples
For data sampled at 1000 Hz, plot the poles and zeros of a 4th-order elliptic lowpass digital filter with cutoff frequency 200 Hz, 3 dB of ripple in the passband, and 30 dB of attenuation in the stopband.
[z,p,k] = ellip(4,3,30,200/500);
zplane(z,p)
grid
title('4th-Order Elliptic Lowpass Digital Filter')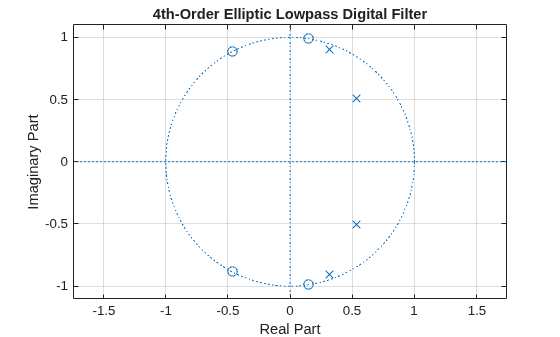
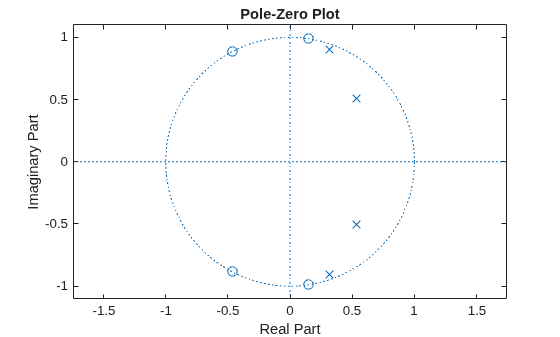
Create the same filter using designfilt. Use zplane to plot the poles and zeros.
d = designfilt('lowpassiir','FilterOrder',4,'PassbandFrequency',200, ...
               'PassbandRipple',3,'StopbandAttenuation',30, ...
               'DesignMethod','ellip','SampleRate',1000);
zplane(d)
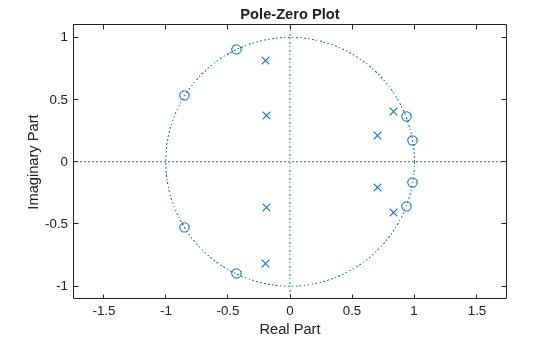
Design an 8th-order Chebyshev Type II bandpass filter with a stopband attenuation of 20 dB. Specify the stopband edge frequencies as rad/sample and rad/sample.
[b,a] = cheby2(8/2,20,[1 5]/8);
Use zplane to plot the poles and zeros of the transfer function.
zplane(b,a)
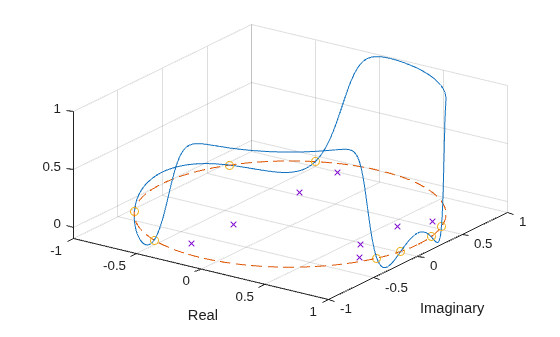
Visualize the zero-phase response of the filter. Overlay the unit circle and the pole and zero locations.
[hw,fw] = zerophase(b,a,1024,"whole");

z = roots(b);
p = roots(a);

plot3(cos(fw),sin(fw),hw)
hold on
plot3(cos(fw),sin(fw),zeros(size(fw)),'--')
plot3(real(z),imag(z),zeros(size(z)),'o')
plot3(real(p),imag(p),zeros(size(p)),'x')
hold off
xlabel("Real")
ylabel("Imaginary")
view(35,40)
grid
Since R2024b
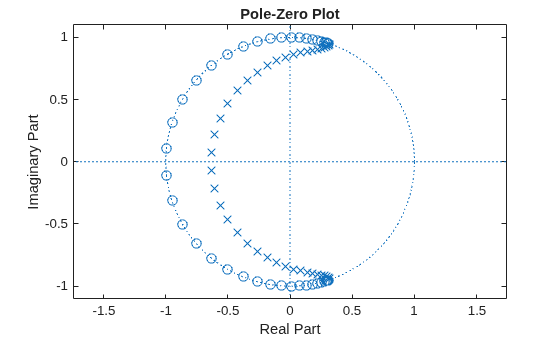
Design a 40th-order lowpass Chebyshev type II digital filter with a stopband edge frequency of 0.4 and stopband attenuation of 50 dB. Plot the zeros and poles of the filter in the z-plane using the filter coefficients in the CTF format.
[B,A] = cheby2(40,50,0.4,"ctf");

zplane(B,A,"ctf")
Input Arguments
Output Arguments
Tips
You can override the automatic scaling of
zplaneusingaxis([xmin xmax ymin ymax])
after calling
zplane. This scaling is useful when one or more zeros or poles have such a large magnitude that the others are grouped tightly around the origin and are hard to distinguish.

