Encontrar la periodicidad utilizando el análisis de frecuencia
A menudo es difícil caracterizar el comportamiento oscilatorio en los datos observando las mediciones de tiempo. El análisis del espectro puede ayudar a determinar si una señal es periódica y a medir los diferentes ciclos.
Un termómetro de un edificio de oficinas mide la temperatura interior cada media hora durante cuatro meses. Cargue los datos y represéntelos. Convierta la temperatura a grados Celsius. Mida el tiempo en semanas. Así, la tasa de muestreo es de 2 mediciones/hora × 24 horas/día × 7 días/semana = 336 mediciones/semana.
load officetemp

tempC = (temp - 32)*5/9;

fs = 2*24*7;
t = (0:length(tempC) - 1)/fs;

plot(t,tempC)
xlabel('Time (weeks)')
ylabel('Temperature ( {}^\circC )')
axis tight

La temperatura parece oscilar, pero las longitudes de los ciclos no se pueden determinar con facilidad. En su lugar, compruebe el contenido frecuencial de la señal.
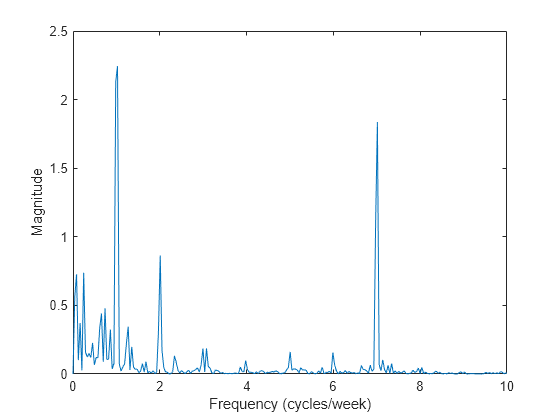
Elimine la media para concentrarse en las fluctuaciones de temperatura. Calcule y represente el periodograma.
tempnorm = tempC - mean(tempC);

[pxx,f] = periodogram(tempnorm,[],[],fs);

plot(f,pxx)
ax = gca;
ax.XLim = [0 10];
xlabel('Frequency (cycles/week)')
ylabel('Magnitude')

Es evidente que la temperatura tiene un ciclo diario y un ciclo semanal. El resultado no es sorprendente, ya que la temperatura sube cuando hay personas trabajando y baja por las noches y los fines de semana.
Consulte también
findpeaks | periodogram | xcorr