Refactor Charts Programmatically
This example shows how to use the Stateflow® API to improve the legibility of Stateflow charts. You can programmatically detect and fix common stylistic patterns such as inconsistent state names, deeply nested states, and unnecessary junctions. For more information about using the Stateflow API, see Overview of the Stateflow API.
Open the Model
This model contains a Stateflow chart that emulates the behavior of an insect. In this model:
The insect is confined to a box.
The insect can only detect objects that are a short distance in front of the insect.
The insect moves in a straight line until it hits a wall or detects a predator or prey.
When the insect hits a wall, the insect bounces off the wall and continues in the opposite direction.
When the insect sees a predator, the insect runs away from the predator at an increased speed.
When the insect sees prey, the insect heads towards the prey at an increased speed.
The insect stops to rest every twelve hours.
The chart uses an inconsistent naming scheme in which some state names start with a capital letter and some state names do not. Additionally, the chart has a deep hierarchy with more than three levels of nested states. Finally, the chart contains superfluous junctions that have only one incoming transition and one outgoing transition.
model = "sfInsectExample";
open_system(model)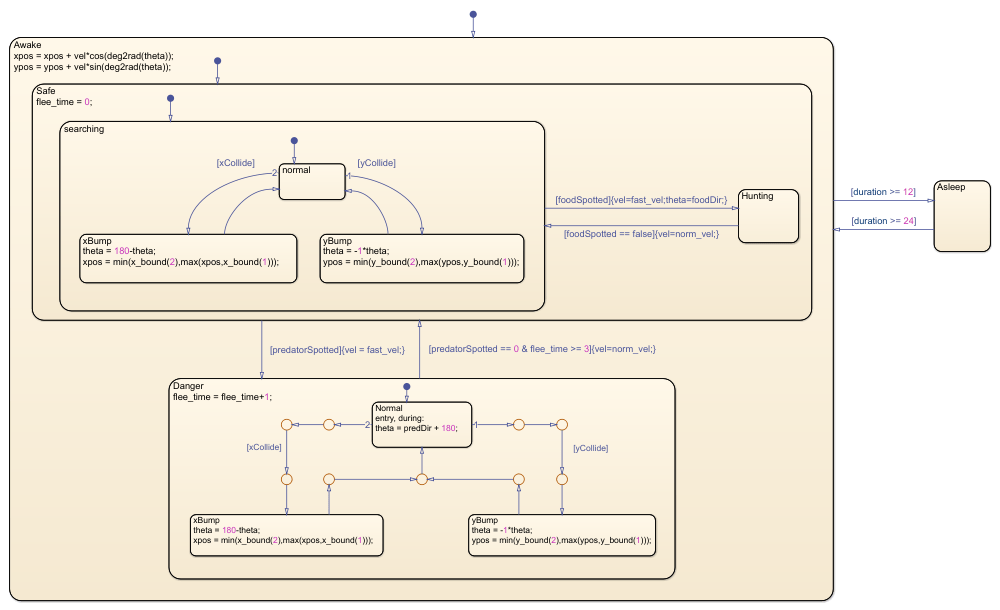
To access the Stateflow.Chart object for the chart, call the find function.
ch = find(sfroot,"-isa","Stateflow.Chart",Name="BehavioralLogic");
Fix Inconsistent State Names
To improve chart readability, use the same naming convention for all states in the chart. For example, you can use a naming scheme in which all state names start with a capital letter. To search for states with names that do not follow this naming convention, call the find function with the optional argument -regexp and specify a regular expression. For more information, see Regular Expressions.
misnamedStates = find(ch,"-isa","Stateflow.State", ...
    "-regexp","Name","^[a-z]\w*");
To inspect the search results, display the path from the model to each state by accessing the Path and Name properties of each Stateflow.State object.
numMisnamedStates = numel(misnamedStates);
misnamedStateNames = "";

for i = 1:numMisnamedStates
    state = misnamedStates(i);
    misnamedStateNames = misnamedStateNames + ...
        newline + " * " + state.Path + "/" + state.Name;
end

disp("The names of these states do not start " + ...
    "with a capital letter:" + newline + misnamedStateNames)
The names of these states do not start with a capital letter:

 * sfInsectExample/BehavioralLogic/Awake/Safe/searching
 * sfInsectExample/BehavioralLogic/Awake/Danger/xBump
 * sfInsectExample/BehavioralLogic/Awake/Danger/yBump
 * sfInsectExample/BehavioralLogic/Awake/Safe/searching/normal
 * sfInsectExample/BehavioralLogic/Awake/Safe/searching/xBump
 * sfInsectExample/BehavioralLogic/Awake/Safe/searching/yBump
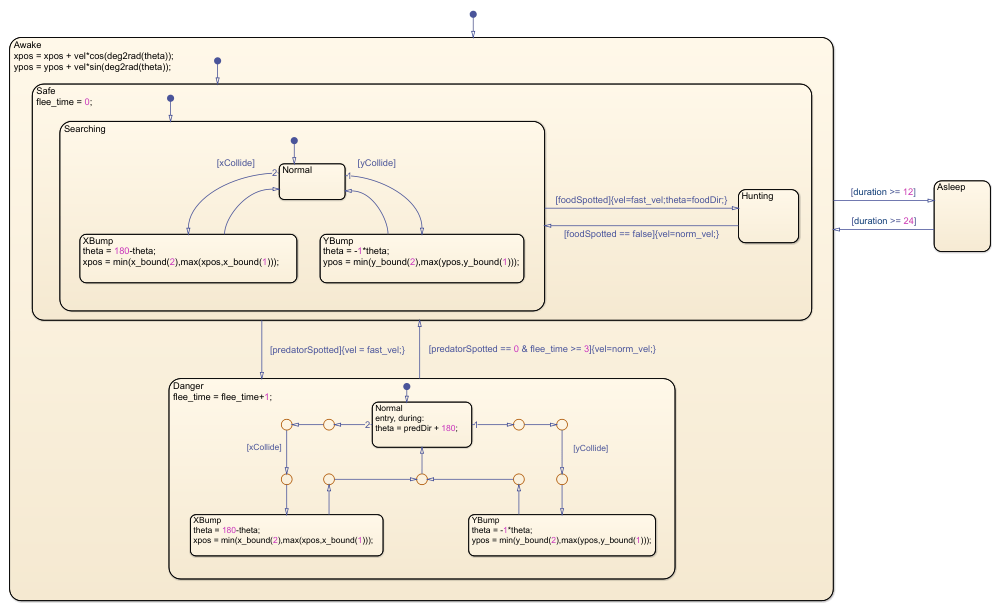
To replace the first letter of each identified state name with its uppercase equivalent, modify the Name property of each Stateflow.State object by calling the renameReferences function.
for i = 1:numMisnamedStates
    state = misnamedStates(i);
    newName = [upper(state.Name(1)) state.Name(2:end)];
    renameReferences(state,newName)
end
Simplify Deep Hierarchy of States
A chart with too many levels of nested states can be difficult to understand. If your chart requires a state hierarchy with more than three levels, you can reduce the complexity of your chart by creating subcharts. For more information, see Encapsulate Modal Logic by Using Subcharts.
To search your chart for deeply nested states, call find with the optional argument -function and specify a function handle that evaluates the helper function getDepth. This function computes the number of levels between a given state and the nearest ancestor chart or subchart. To view the code for this function, see Get Depth of State.
maxDepth = 3;
deepStates = find(ch,"-isa","Stateflow.State", ...
    "-function", @(s)(getDepth(s) > maxDepth));

numDeepStates = numel(deepStates);
deepStateNames = "";

for i = 1:numDeepStates
    state = deepStates(i);
    deepStateNames = deepStateNames + ...
        newline + " * " + state.Path + "/" + state.Name;
end

disp("These states occur at a depth greater than " + ...
    maxDepth + ":" + newline + deepStateNames)
These states occur at a depth greater than 3:

 * sfInsectExample/BehavioralLogic/Awake/Safe/Searching/Normal
 * sfInsectExample/BehavioralLogic/Awake/Safe/Searching/XBump
 * sfInsectExample/BehavioralLogic/Awake/Safe/Searching/YBump
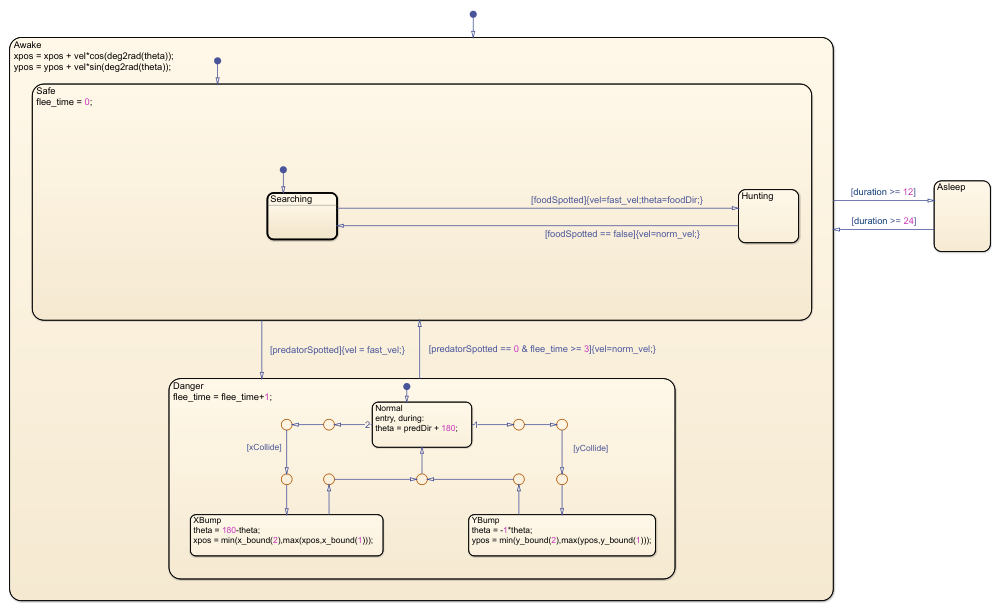
To simplify a chart with a deep hierarchy of states, convert states to subcharts by setting the IsSubchart property for the Stateflow.State objects to true. To automate this process for a large chart, the helper function convertStatesToSubcharts recursively finds nonleaf states at a given depth of the hierarchy and converts these states into subcharts. The function also disables the content preview and resizes the new subcharts. To view the code for this function, see Convert States to Subcharts.
convertStatesToSubcharts(ch,maxDepth)
Remove Superfluous Junctions
Long transition paths can increase the complexity of your charts. For example, to connect a source to a destination without any branching, using a single transition is simpler than using a sequence of transitions with multiple superfluous junctions.
To identify superfluous junctions, call find with the optional argument -function and specify a handle to the helper function isSuperfluous. This function checks whether a given junction satisfies these conditions:
The junction has only one incoming transition and one outgoing transition.
The outgoing transition continues in the same direction as the incoming transition.
An action in the incoming transition does not precede a trigger or condition in the outgoing transition.
Both transitions are not guarded by triggers.
To view the code for this function, see Identify Superfluous Junctions.
superfluousJunctions = find(ch,"-isa","Stateflow.Junction", ...
    "-function", @(j)(isSuperfluous(j)));

numSuperfluousJunctions = numel(superfluousJunctions);
superfluousJunctionIDs = "";

for i = 1:numSuperfluousJunctions
    junction = superfluousJunctions(i);
    superfluousJunctionIDs = superfluousJunctionIDs + newline + ...
        " * Junction " + junction.SSIdNumber + " in " + junction.Path;
end

disp("These junctions are part of a transition path " + ...
    "that you can replace" + newline + "with a single transition:" + ...
    newline + superfluousJunctionIDs)
These junctions are part of a transition path that you can replace
with a single transition:

 * Junction 161 in sfInsectExample/BehavioralLogic/Awake/Danger
 * Junction 163 in sfInsectExample/BehavioralLogic/Awake/Danger
 * Junction 153 in sfInsectExample/BehavioralLogic/Awake/Danger
 * Junction 155 in sfInsectExample/BehavioralLogic/Awake/Danger
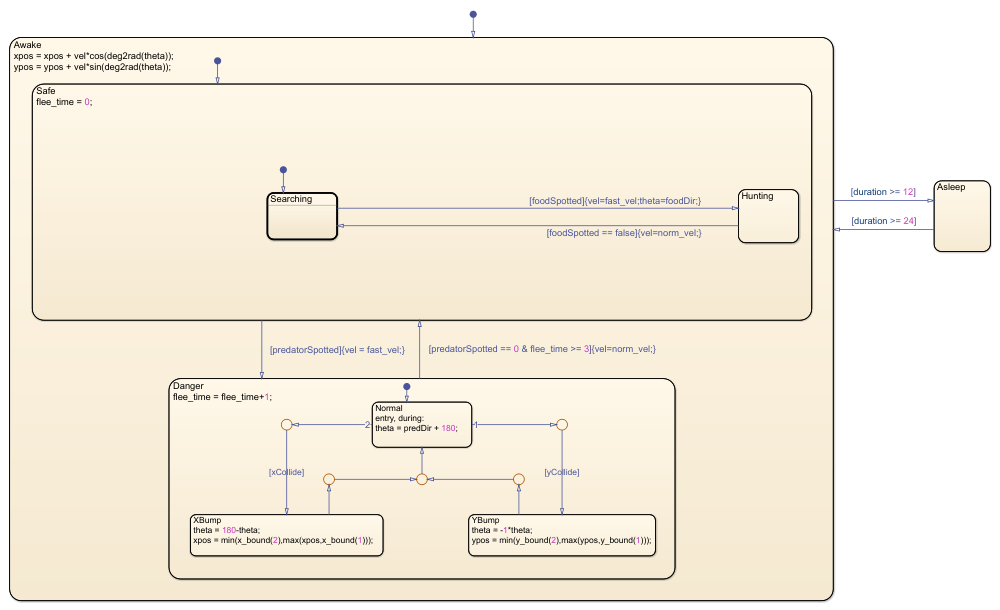
The helper function removeJunctions replaces the two transitions around each superfluous junction with a single transition. To preserve the geometry of the chart, the new transition starts at the same point as the original incoming transition and ends at the same point as the original outgoing transition. To view the code for this function, see Remove Junctions.
removeJunctions(superfluousJunctions)
Close the Model
Save the changes in a new model and close the model.
newModel = model+"Refactored";
sfsave(model,newModel)
close_system(newModel)
Helper Functions
Get Depth of State
This function returns the number of levels between a given state and the nearest ancestor chart or subchart.
function depth = getDepth(state)

parent = getParent(state);

if isa(parent,"Stateflow.Chart")
    depth = 1;
elseif parent.isSubchart
    depth = 1;
else
    depth = getDepth(parent)+1;
end
end
Convert States to Subcharts
This function identifies nonleaf states at a given depth from the parent chart or subchart. The function converts these states into subcharts and disables the content preview of the new subcharts by modifying the IsSubchart and ContentPreviewEnabled properties for each Stateflow.State object. When possible, the function reduces the size of the subchart to a default of 90-by-60 while keeping the center of the subchart fixed. The process repeats recursively in each of the new subcharts.
function convertStatesToSubcharts(parent,maxDepth)

statesToConvert = find(parent,"-isa","Stateflow.State", ...
    "-function", @(s) (getDepth(s) == maxDepth), ...
    "-function", @(s) (~isempty(getChildren(s))), ...
    IsSubchart=false);

for i = 1:numel(statesToConvert)
    state = statesToConvert(i);
    state.IsSubchart = true;
    state.ContentPreviewEnabled = false;

    reduceWidth(state,90)
    reduceHeight(state,60)

    convertStatesToSubcharts(state,maxDepth);
end
end

function reduceWidth(state,newWidth)
pos = state.Position;
if pos(3) > newWidth
    state.Position = [pos(1)+pos(3)/2-newWidth/2 ...
        pos(2) newWidth pos(4)];
end
end

function reduceHeight(state,newHeight)
pos = state.Position;
if pos(4) > 60
    state.Position = [pos(1) pos(2)+pos(4)/2-newHeight/2 ...
        pos(3) newHeight];
end
end
Identify Superfluous Junctions
This function checks whether a given junction satisfies these conditions:
The junction has only one incoming transition and one outgoing transition.
The outgoing transition continues in the same direction as the incoming transition.
An action in the incoming transition does not precede a trigger or condition in the outgoing transition.
Both transitions are not guarded by triggers.
function tf = isSuperfluous(junction)

transitionIn = sinkedTransitions(junction);
transitionOut = sourcedTransitions(junction);

tf = oneIncomingTransition && oneOutgoingTransition && ...
    transitionsContinueInSameDirection && ...
    noActionBeforeTriggerOrCondition && ...
    noDoubleTriggers;

function tf = oneIncomingTransition
    tf = (isscalar(transitionIn));
end

function tf = oneOutgoingTransition
    tf = (isscalar(transitionOut));
end

function tf = transitionsContinueInSameDirection
    tolerance = 1.5;
    theta = abs(transitionIn.DestinationOClock - ...
        transitionOut.SourceOClock);
    tf = (abs(theta-6) < tolerance);
end

function tf = noActionBeforeTriggerOrCondition
    tf = isempty(transitionIn.ConditionAction) || ...
        (isempty(transitionOut.Trigger) && ...
        isempty(transitionOut.Condition));
end

function tf = noDoubleTriggers
    tf = isempty(transitionIn.Trigger) || ...
        isempty(transitionOut.Trigger);
end
end
Remove Junctions
This function replaces the transitions around each superfluous junction with a single transition. To preserve the geometry of the chart, the new transition starts at the same point as the original transition entering the junction and ends at the same point as the original transition exiting the junction. The function merges the labels strings of the original transitions according to these rules:
Only one transition can have a nonempty trigger.
Combine nonempty conditions by using the AND operator
&&.Combine nonempty condition and transition actions by juxtaposition. If the first action does not end in a comma or semicolon, add a comma in between the actions.
For more information, see Define Actions in a Transition.
function removeJunctions(junctionsToRemove)

for i = 1:numel(junctionsToRemove)
    junction = junctionsToRemove(i);

    transitionIn = sinkedTransitions(junction);
    transitionOut = sourcedTransitions(junction);

    newSourceEndpoint = transitionIn.SourceEndpoint;
    newSourceOClock = transitionIn.SourceOClock;
    newDestinationEndpoint = transitionOut.DestinationEndpoint;
    newMidPoint = (newSourceEndpoint+newDestinationEndpoint)/2;
    newLabelString = mergeLabelStrings;

    transitionIn.Destination = transitionOut.Destination;
    transitionIn.SourceOClock = newSourceOClock;
    transitionIn.DestinationEndpoint = newDestinationEndpoint;
    transitionIn.MidPoint = newMidPoint;
    transitionIn.LabelString = newLabelString;
    transitionIn.LabelPosition = [newMidPoint 0 0];
    transitionIn.LabelPosition(1) = ...
        transitionIn.LabelPosition(1)-transitionIn.LabelPosition(3)/2;
    transitionIn.LabelPosition(2) = ...
        transitionIn.LabelPosition(2)-transitionIn.LabelPosition(4)/2;
    delete(junction)
    delete(transitionOut)
end

function label = mergeLabelStrings

    trigger1 = transitionIn.Trigger;
    trigger2 = transitionOut.Trigger;
    if isempty(trigger1)
        label = trigger2;
    elseif isempty(trigger2)
        label = trigger1;
    else
        error("Unable to merge transitions with multiple " + ...
            "triggers " + trigger1 + " and " + trigger2 + ".")
    end

    condition1 = transitionIn.Condition;
    condition2 = transitionOut.Condition;
    if ~isempty(condition1) && ~isempty(condition2)
        label = label+"["+condition1+" && "+condition2+"]";
    elseif ~isempty(condition1)
        label = label+"["+condition1+"]";
    elseif ~isempty(condition2)
        label = label+"["+condition2+"]";
    end

    action1 = transitionIn.ConditionAction;
    action2 = transitionOut.ConditionAction;
    if ~isempty(action1) && ~isempty(action2)
        if endsWith(action1,";") || endsWith(action1,",")
            label = label+"{"+action1+action2+"}";
        else
            label = label+"{"+action1+","+action2+"}";
        end
    elseif ~isempty(action1)
        label = label+"{"+action1+"}";
    elseif ~isempty(action2)
        label = label+"{"+action2+"}";
    end

    transaction1 = transitionIn.TransitionAction;
    transaction2 = transitionOut.TransitionAction;
    if ~isempty(transaction1) && ~isempty(transaction2)
        if endsWith(transaction1,";") || endsWith(action1,",")
            label = label+"/{"+transaction1+transaction2+"}";
        else
            label = label+"/{"+transaction1+","+transaction2+"}";
        end
    elseif ~isempty(transaction1)
        label = label+"/{"+transaction1+"}";
    elseif ~isempty(transaction2)
        label = label+"/{"+transaction2+"}";
    end
end
end