Reuse Logic in Charts
You can reuse logic in Stateflow® charts by calling custom functions in states or transitions. Stateflow charts support these custom functions:
Graphical functions contain a flow chart that consists of junctions and transitions.
Simulink® functions contain a Simulink subsystem.
MATLAB® functions contain MATLAB code.
In this example, you create a MATLAB function that enables a model of a rechargeable battery system to handle varying power input when plugged into a charger.
Open Model
The sfGetStartedFunction model represents the control logic for a rechargeable battery system. To build the model, follow the instructions in the previous steps of the tutorial.
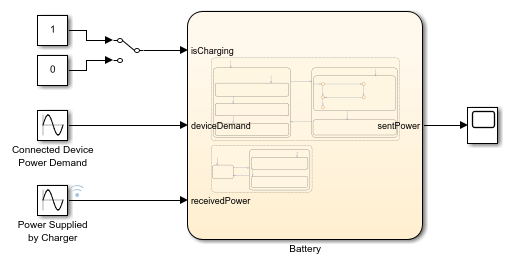
Double-click the Chart block.
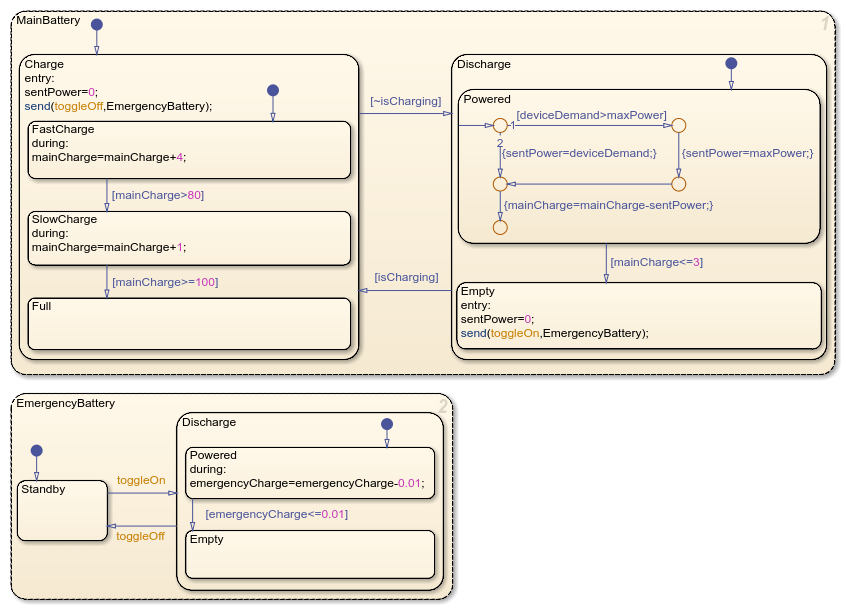
The chart contains two parallel states that represent a rechargeable main battery and non-rechargeable emergency battery. Each battery contains nested child states that represent operating modes for charging, discharging, or standing by.
When the main battery becomes empty, it sends an event that activates the discharging mode of the emergency battery. When the main battery begins charging, it activates the standby mode of the emergency battery.
The chart uses these data:
isCharging— Input data that represents whether or not the battery system is connected to a charger. This data determines the active state of the main battery.deviceDemand— Input data that represents the power demand of the connected device, in watts.maxPower— Local data that represents the maximum power output of the main battery, in watts.sentPower— Output data that represents how much power the main battery delivers to the connected device, in watts.receivedPower— Input data that represents the power supplied to the main battery by the charger, in watts.mainChargeandemergencyCharge— Local data that represents the charge level of each battery.
Create MATLAB Function
Currently, if the charger provides more or less power, the battery system does not charge faster or slower. Add a MATLAB function that allows the battery to receive variable input power within a minimum and maximum value.
To create the MATLAB function, in the palette, click the MATLAB function icon
 . Place the function in an empty
section of canvas.
. Place the function in an empty
section of canvas.The editor prompts you to enter a function label. The function label specifies the return values, name, and inputs of the MATLAB function, using this format:
[return_val1,return_val2,....] = function_name(input1,input2,...)Function labels with a single return value do not require braces.
Enter a function label that inputs the current charge, the additional charge provided by the charger, and the maximum input charge. Return the updated battery charge.
charge=updateCharge(current,added,max)
To edit the MATLAB function, double-click any part of the function below the function label. The function editor opens and displays this header:
The function editor copies the header from the function label in the chart. If you change the header, the function label also changes.function charge=updateCharge(current,added,max)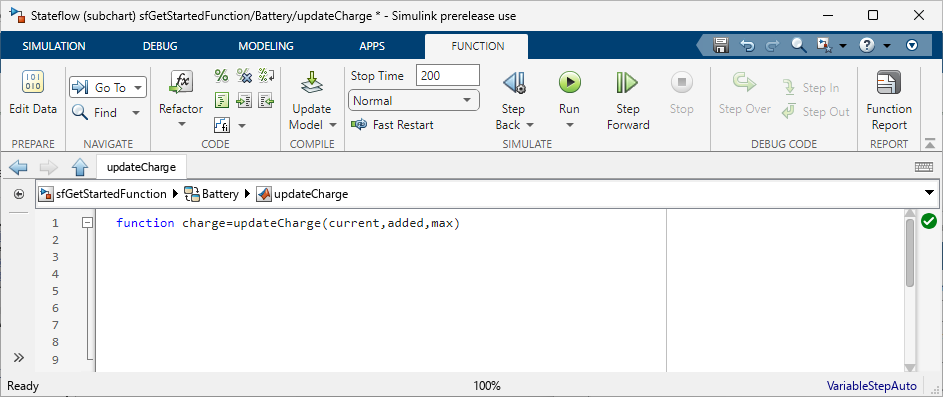
In the function editor, write a function that constrains the battery charging speed between a maximum value and
0.function charge=updateCharge(current,added,max) if added>max charge=current+max; elseif added<0 charge=current; else charge=current+added; end
Add MATLAB Function to State Actions
Use the MATLAB function in the states FastCharge and
SlowCharge.
To return to the Stateflow Editor, in the Explorer Bar, click the Up To Parent button
 .
.In the state
FastCharge, modify theduringaction to use the function. For the maximum input charge, use4, the value the chart currently adds tomainCharge.during:mainCharge=updateCharge(mainCharge,receivedPower,4);In the state
SlowCharge, modify theduringaction to use the function. For the maximum input charge, use1, the value the chart currently adds tomainCharge.during:mainCharge=updateCharge(mainCharge,receivedPower,1);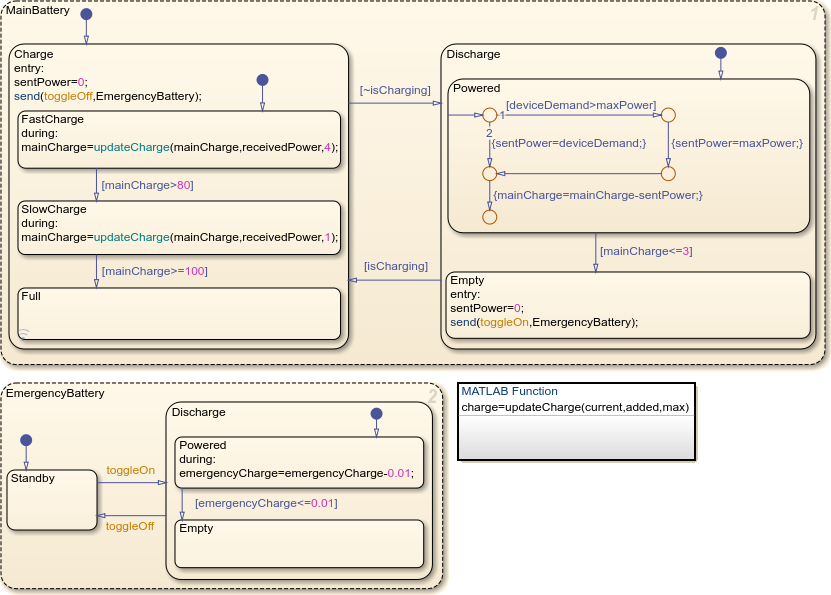
Simulate Model
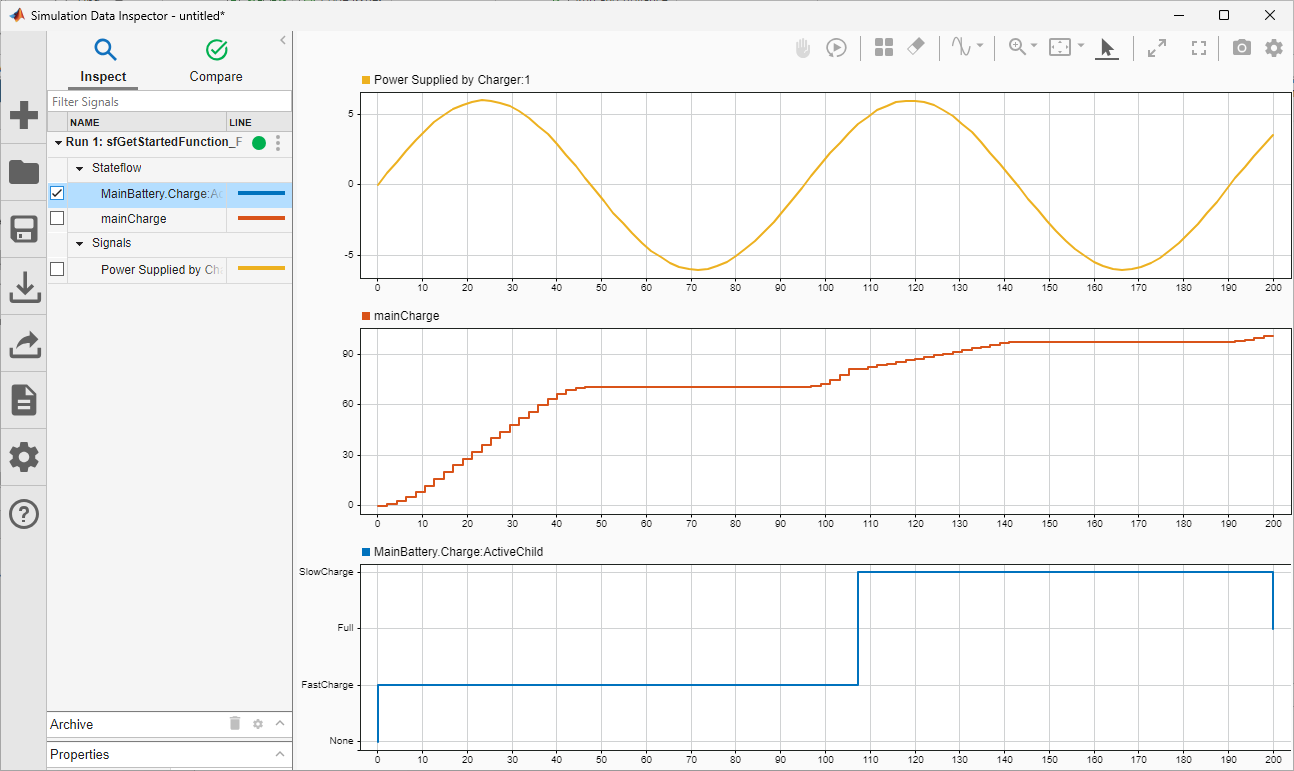
The model logs these values to the Simulation Data Inspector:
The power supplied to the battery system by the charger. The value varies between
-6and6.The charge level of the main battery.
The name of the active charging mode of the main battery.
Simulate the model and use the Simulation Data Inspector to
observe how the value of mainCharge changes during
simulation.
When the main battery charges quickly, the charge level increases and
decreases with the power supplied, to a maximum of 4 and a
minimum of 0. When the main battery charges slowly, the
charge level increases and decreases with the power supplied, to a maximum of
1 and a minimum of 0.