Reading Excel Data into MATLAB with a GUI, Part 1
From the series: Reading Excel Data into MATLAB with a GUI
(Originally posted on Doug's MATLAB Video Tutorials blog.)
It was pretty easy to read in the data with XLSREAD. Note that three minutes into the video above, I use a neat cell mode trick that many might not know about.
Recorded: 28 Sep 2007
Our question today comes from one of our MATLAB® users named Sarah, who is trying to read in an Excel® file and do some plotting of the data in that Excel file in MATLAB. Let's look at the file that she sent me.
We can see that there are a lot of different columns here of data and that, not including the header row, we go down and see there are 60 different values in here. And so we want to read that into MATLAB and get a graph out. That graph is going to be just of one column versus another.
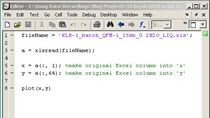
So how would we do that in MATLAB? We can see the file that we wrote here to solve this problem. The first thing is I need to know the file name that we want to read in and that just happens to be shown right here. You can see this is probably part of a series of many files that she's going to be reading in and doing graphics on.
So to read this data in, we simply are going to say A is equal to xlsread and then the file name. That's going to allow MATLAB to read in this data. Let's select those two lines of code only, right click, and say Evaluate Selection. That's going to run those two pieces of code.
Now if we go to the workspace browser, what we're going to see is we have the file name defined and, of course, that data-- 59 rows, as expected, and then 89 columns from the 89 columns of data on the first sheet of that worksheet. We could have specified to read sheet 2 or 3, but the data we were interested in happened to be on the first, so we didn't have to specify. It was just the default.
Now that we have this A data, why don't we turn it into columns that are easier to work with? In this case, maybe we wanted to plot the x values, which would be just what was stored in the first column, which was basically counting from 1 to 60. And in y, we're going to read in, let's say, the 20th column and plot that.
So we can simply take this A matrix and say I want x to be—take A, all the rows, column 1, and make that x. Then we're going to do the same thing for y. We're just going to say, let y be equal to matrix A, all the rows-- that's what the column means-- comma 60, so the 60th column. And then we will plot this.
So let's select those commands and evaluate selection. And we see that we have this plot out there. So that's how simple it can be to bring in this data and plot it inside of MATLAB.
Now let's show a little bit more advanced trick here. Let me move my windows around so you can see two of them at once. And let's say that, instead of just plotting number 60, we might want plot 61. So I'll change that to 61 and hit F5 to save and run, and that's going to update my plot.
But let's say I want to look at a lot of these. What I can do is select that number, come up here to the cell mode, make sure it's enabled by going to Cell and Disable or Enable Cell Mode, and hit plus 1. It's going to increment that value 61 to 62 and re-evaluate everything in that cell, or in this case, the entire file. We hit that again and we'll see number 63, 64, and so on. So you could go through here and look at your data in a very quick manner doing that little trick.
OK. As always, if you have questions, send them to me and we'll see if we can't answer them in this forum. Thank you.


