Developing Detection Algorithms to Reduce False Alarms in Intensive Care Units
By Filip Plesinger, Institute of Scientific Instruments of the Czech Academy of Sciences
False alarms from electrocardiographs, pulse oximeters, and other patient monitoring devices are a serious problem in intensive care units (ICUs). One study found that up to 86% of ICU alarms are false1, and another indicated that less than 10% were important for patient management2. The noise from false alarms disturbs patients’ sleep, and the frequency of the false alarms can cause clinical staff to become desensitized to warnings, leading to slower response times.
A recent PhysioNet/Computing in Cardiology Challenge aimed to reduce the incidence of ICU false alarms. Competitors were tasked with developing algorithms that could distinguish between true and false alarms in signals recorded by ICU monitoring devices.
The algorithms my colleagues and I developed in MATLAB® won first place in the real-time category of the challenge and second place in the retrospective category. Our algorithms produced a true positive rate (TPR) and true negative rate (TNR) of 92% and 88%, respectively.
PhysioNet/Computing in Cardiology Challenge Goals and Requirements
The 2015 challenge focused on the accurate detection of five arrhythmias:
- Asystole - No heartbeats for four seconds or longer
- Bradycardia - A heart rate lower than 40 beats per minute (bpm) for five consecutive beats
- Tachycardia - A heart rate higher than 140 bpm for 17 consecutive beats
- Ventricular tachycardia - Five or more ventricular beats (beats that begins in the ventricles rather than the atria) with a heart rate higher than 100 bpm
- Ventricular flutter or fibrillation - A fibrillatory heart rhythm lasting four seconds or longer
Teams were provided with 750 five-minute recordings of ICU data from the Physionet database sampled at 250 Hz. Each recording included two ECG channels and signals from an ABP monitor, a PPG device, or both.
Algorithms submitted to the PhysioNet/CinC challenge were scored in two categories: real-time and retrospective. In the real-time category, the algorithms were evaluated on their ability to correctly identify true and false alarms using only the data available before the actual alarm was triggered. In the retrospective category, the algorithms could use up to 30 seconds of additional data recorded after the alarm was triggered.
Challenge organizers tested the submitted algorithms on a set of 500 recordings previously undisclosed to the participants. The algorithms were scored based on a formula that rewarded true positives and true negatives while penalizing false positives and false negatives. All algorithms were presented at the international Computing in Cardiology conference. After the conference, organizers announced the “follow-up” phase of the challenge, where contestants were encouraged to further improve their algorithms. The follow-up phase ended in February 2016.
Choosing an Approach
While participants were permitted to write their algorithms in any language they chose, organizers provided integral support for MATLAB by making the dataset available as MATLAB files and providing an example detection algorithm written in MATLAB and a complimentary MATLAB license. I usually program in C# or Java®, and I was new to MATLAB, but I decided to use MATLAB because it would enable me to focus just on algorithm development. Many of the capabilities I needed were readily available. For example, when I needed to generate a histogram, compute a fast Fourier transform (FFT), or apply a finite impulse response (FIR) filter, all I had to do was invoke the appropriate MATLAB function.
Finding and Eliminating Invalid Data
One of the most surprising – and trying – aspects of the challenge was the poor condition of the signals produced by the ICU monitoring equipment. Poor signal quality was not the fault of PhysioNet; it is a common occurrence that can be caused by patient movement, wiring problems, misplacement of leads, misconfigured devices, and many other issues. One symptom of poor signal quality is saturation, which causes distortions as the waveform is flattened at its highest amplitudes (Figure 1).

Figure 1. A saturated signal showing distortion with its values clipped. The proposed algorithm can detect QRS even in signals like these.
To minimize the effects of saturation and signal noise, my MATLAB algorithms had to identify and eliminate invalid data from the input signals. The algorithms analyzed the statistical properties of each signal in two-second blocks. For each block, the maximum amplitude, minimum amplitude, and standard deviation were compared to established limits for valid data. The algorithms identified areas of high-frequency noise by checking the amplitude envelope of the signal in the frequency range of 70-90 Hz. The algorithms identified signal saturation by computing a histogram of the signal amplitude and comparing the value of the histogram’s first and last bins with values in the middle bins.
Any data identified as invalid was ignored by the remaining algorithms for detecting heartbeats. For this reason, I had to tune the invalid data detection algorithm so that it would not eliminate too much data. (As Figure 1 shows, a saturated signal may still contain meaningful information.)
Detecting QRS Complexes
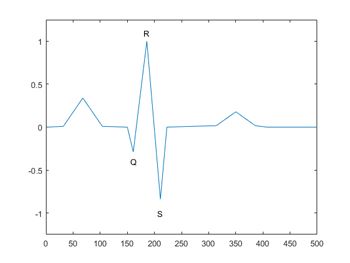
In an ECG, heartbeats are characterized by three successive deflections of the trace from its baseline (Figure 2). These deflections, collectively known as a QRS complex, reflect the activation of the ventricles. They are a vital marker for diagnosing asystole, bradycardia, and tachycardia.

Figure 2. A QRS complex from an ECG signal.
To detect QRS complexes in ECG channels, the algorithms we developed compute amplitude envelopes in three frequency ranges using Fourier transform functions from Signal Processing Toolbox™. By analyzing and comparing the amplitudes of these three envelopes, the algorithms can detect QRS complexes, distinguish between normal and ventricular heartbeats, and filter out false QRS complexes caused by cardiac pacemaker stimuli.
Detecting QRS complexes in PPG and ABP channels required a different approach. For these channels, the algorithms apply a simple low-pass filter from Signal Processing Toolbox and then identify local minima in the filtered signal. The algorithms perform linear interpolation on the signal to either side of each minimum and check the slope of the resulting lines to determine whether the minimum comes from a QRS complex.
Checking for Normal Heart Rhythms
The output of the QRS complex detection algorithm is an array of times at which the R peak in each QRS complex occurred in the final 10-16 seconds of each signal. (We did not analyze the entire five-minute recording; the Physionet Challenge requirements state that the onset of the event raising an alarm must be within 10 seconds of the 300th second of each file.) From the array of R peak values, the algorithms compute RR intervals, which measure the time between two consecutive heartbeats.
To check for normal heart rhythms, the algorithms call Statistics and Machine Learning Toolbox™ functions to perform a statistical analysis of the RR intervals. In addition to summing and computing the mean and standard deviation of the intervals, the algorithms calculate the minimum and maximum heart rate. They compare all the results from these calculations to established limits for normal rhythms to identify beat series with a reasonable QRS complex distribution. If one of the available channels – ECG, PPG, or ABP – passes this test, the heart rhythm is deemed to be normal, and a false alarm is reported. This analysis alone revealed about 35% of the false alarms in the training data.
Evaluating Alarms
If the algorithms detect abnormal heart activity on all of the channels, the next step is to prove or deny alarm reported by the ICU device.
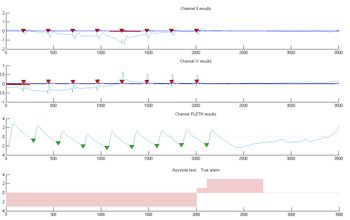
The test for asystole uses a voting algorithm in which each channel is weighted by its invalid rate. Channels with lower invalid rates have a stronger influence on the results. The algorithm divides the signals from each channel into 3.2-second segments. For each segment, the algorithm updates a result vector R, adding the weighted vote value for any channel in which no heartbeat is present and subtracting the weighted vote value for any channel in which a heartbeat is detected. When any value in the result vector R is positive, the algorithm declares that it has identified asystole (Figure 3).

Figure 3. Two ECG signals and one PPG signal showing asystole. Votes are accumulated in the result vector R, with positive values reflecting agreement that no heartbeats are present
The tests for bradycardia, tachycardia, and ventricular tachycardia calculate bpm using the RR intervals from the most reliable channel available, which is typically the ECG. If the heart rate falls below 46 bpm, the algorithm reports bradycardia. If the heart rate exceeds 130 bpm or 95 ventricular bpm, the algorithm reports tachycardia or ventricular tachycardia, respectively.
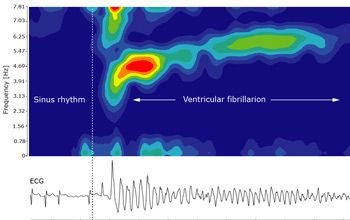
The final test is for ventricular fibrillation, or flutter. Fibrillation identification does not rely on QRS detection results because when the heart is in fibrillation there are no QRS complexes. Instead, the algorithm performs a short-time Fourier transform with a moving window using Signal Processing Toolbox. It then looks for frequency peaks above 2 Hz, which is an indication of fibrillation or flutter (Figure 4).
We considered using machine learning approaches to classify arrhythmia, but opted for traditional statistical methods for two reasons: We had good existing domain knowledge of which features in the data could be used to confirm or deny specific alarm, and machine learning algorithms are typically more difficult to implement and calibrate in hardware, which would be necessary for deployment in an ICU.

Figure 4. Time-frequency analysis of ventricular fibrillation. Frequency peaks in the range of 3-6Hz indicate fibrillation or flutter.
Winning the PhysioNet/Computing in Cardiology Challenge
After developing the algorithms, testing them on the training data provided by the PhysioNet/Computing in Cardiology Challenge organizers, and refining them to maximize performance on the data, I submitted them for judging. When my algorithms were run on the test set of 500 recordings, they correctly classified 92% of true alarms and 88% of false alarms. They achieved the highest overall score in the real-time part of the competition among the 244 entries submitted. In the follow-up phase of the challenge, our results were higher, and we earned the highest score in the real-time category.
My colleagues and I are looking forward to seeing the techniques applied in these algorithms implemented in hardware and used in the ICU to reduce false alarms.
About PhysioNet
Established in 1999 as the NIH-sponsored Research Resource for Complex Physiologic Signals, PhysioNet has attained a preeminent status among data and software resources in biomedicine. Its data archive, PhysioBank, was the first, and remains the world’s largest, most comprehensive, and most widely used repository of time-varying physiologic signals and high-resolution clinical ICU data. Its software collection, PhysioToolkit, supports exploration and quantitative analyses of PhysioBank and similar data with a wide range of well-documented, rigorously tested open-source software that can be run on any platform. Its incubation laboratory, PhysioNetWorks, inaugurated in 2011, allows collaborating researchers to share and study their own data and software securely and privately before contributing them to PhysioNet for open distribution.
PhysioNet resources are freely available on the web, and are made available under the ODC Public Domain Dedication and License v1.0. PhysioNet is supported by the National Institute of General Medical Sciences (NIGMS) and the National Institute of Biomedical Imaging and Bioengineering (NIBIB) under NIH grant number 2R01GM104987-09.
1 S.T. Lawless,”Crying wolf: false alarms in a pediatric intensive care unit,” Crit Care Med 1994; 22 (6): 981-985.
2 C.L. Tsien, J.C. Fackler, “Poor prognosis for existing monitors in the intensive care unit,” Crit Care Med, 25 (4) (1997), pp. 614-619 Apr
Published 2016 - 93063v00